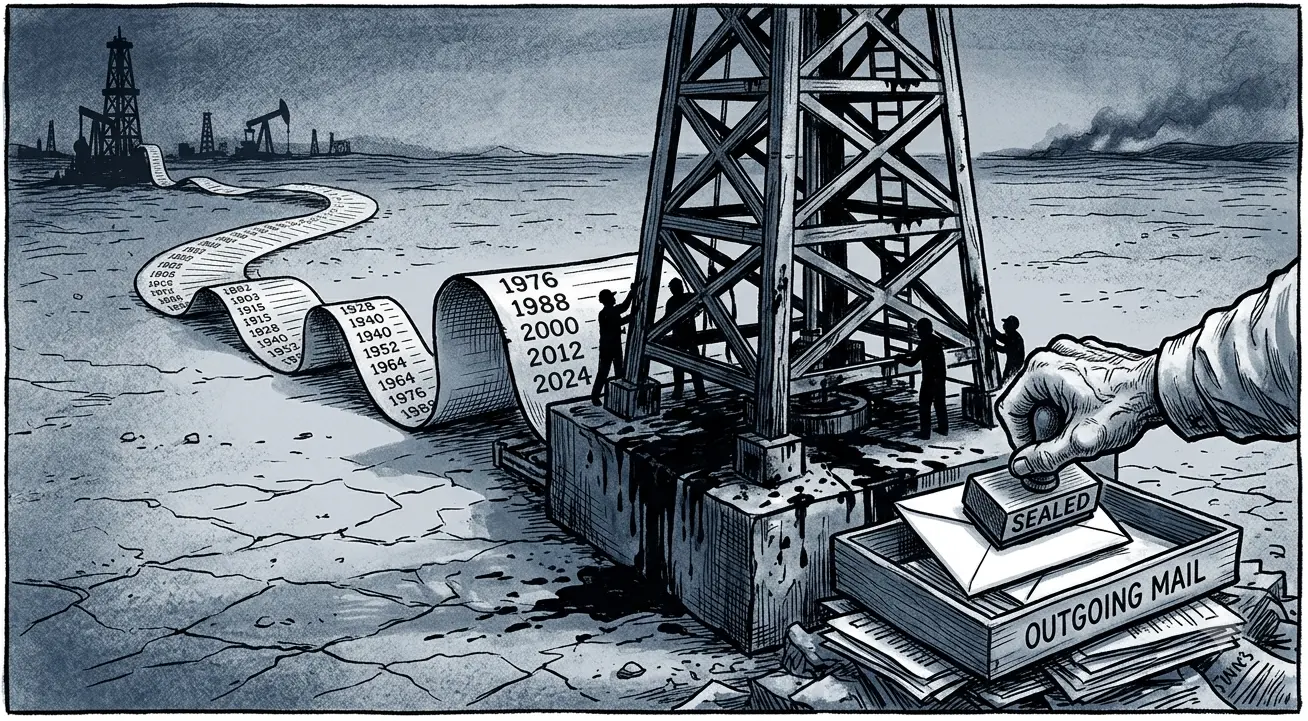
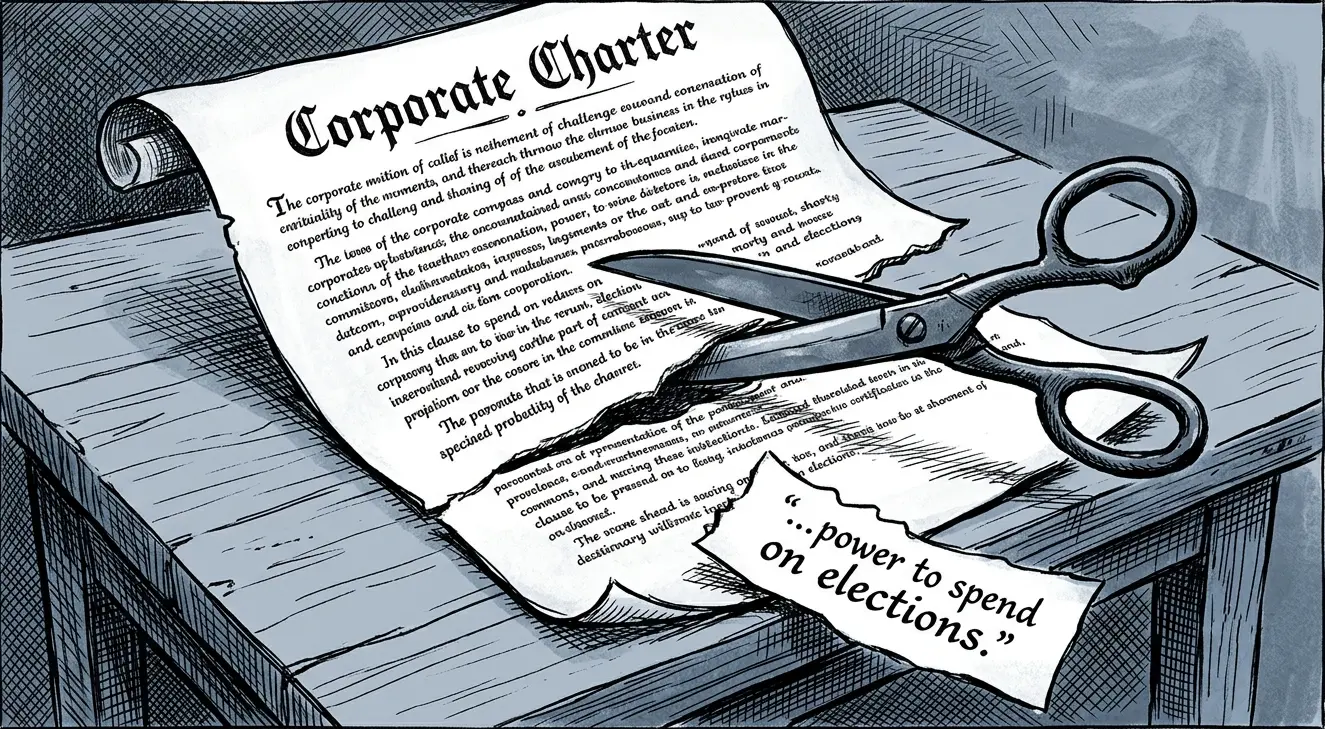
Author: sts

  • The Precision Instrument

    The Precision Instrument

    Block 3, Article 1 — One Person, One Vote Made It Worse

    © 2026 Steve Sagnotti.

    How are the lines around your district drawn — and by whom?

    Before 1964, the map was already broken — just broken differently.

    State legislatures drew district lines and then didn’t redraw them. For decades. Alabama ran on its 1900 census districts until 1964. Rural counties with a few thousand voters sent the same number of representatives to the state legislature as urban counties with hundreds of thousands. A vote cast in the country outweighed a vote cast in the city by a factor of ten or twenty or more, depending on the state. The distortion wasn’t hidden — it was the point. Rural legislative majorities protected rural legislative majorities by refusing to redraw the maps that produced them.

    The cities were growing. The maps didn’t change. The room was already a fiction.

    The reform that handed over the instrument

    The Warren Court fixed it. Reynolds v. Sims (1964) established the principle in a phrase that still sounds self-evident: legislators represent people, not trees or acres. Equal-population districts, required after every census. The rural bloc that had ignored the urban majority for generations lost its legal anchor. Malapportionment was over.

    Justice John Marshall Harlan II dissented. He predicted what would follow: states that couldn’t draw lines by geography would gerrymander by party instead, producing the same distortion through a different door. He was right — though even he likely didn’t anticipate how right.

    Equal-population districts didn’t constrain the gerrymander. They enabled a more precise version of it.

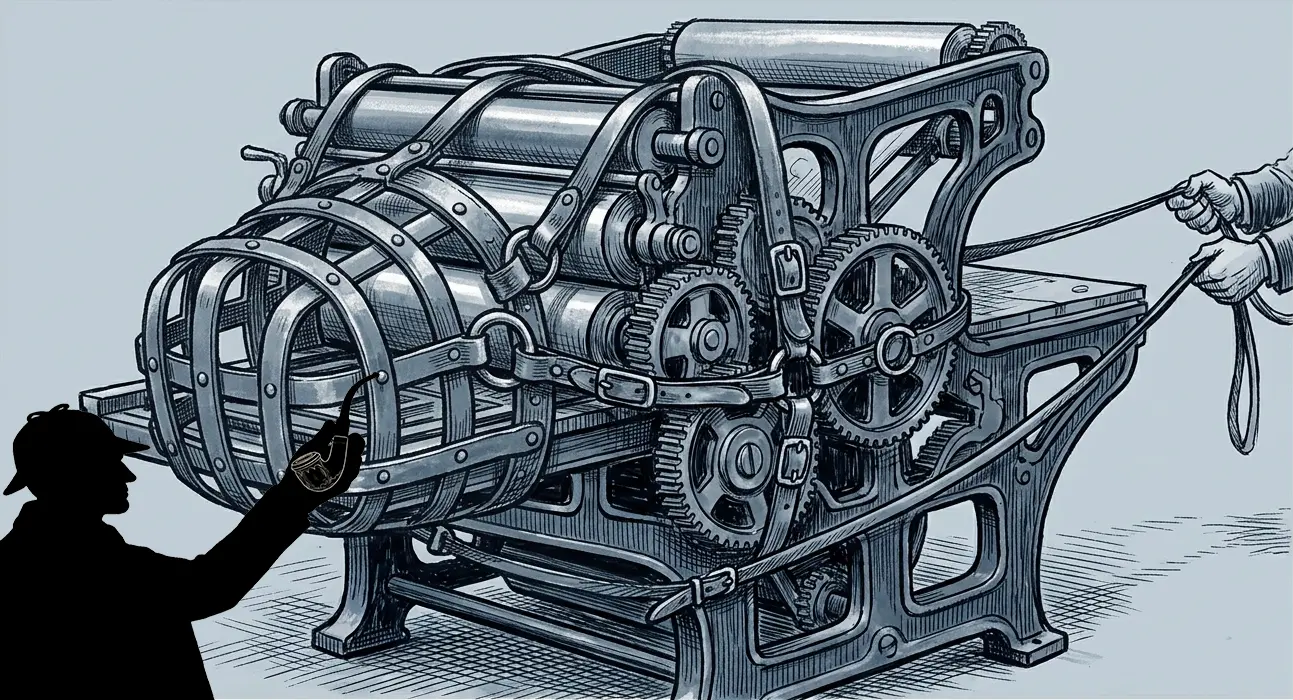
    Here is what Reynolds actually did: it set a mathematical requirement — every district must contain approximately the same number of people — and then left everything else to the states. Which people go in which district remained entirely up to whoever drew the map. And when every district must contain the same number of people, the only remaining variable is which people. Pack your opponent’s voters into as few districts as possible. Crack the remainder into thin minorities spread across adjacent districts. The constraint wasn’t a check on manipulation. It was a specification for it.

    Reynolds handed mapmakers a precision requirement. It did not give the public any say in how that precision was used.

    Reynolds didn’t strip away a compactness requirement — a rule that a district has to be a reasonably regular shape, not one gerrymandered to grab specific voters — because there wasn’t one left to strip. Congress had already dropped federal compactness and contiguity standards — the requirement that a district be one connected shape, not several separate pieces stitched together — in 1929, the same legislative moment The Frozen Room documents freezing the House at 435 seats — one repeal that left the chamber unable to grow, the other that left the map under no obligation to make sense.

    The Reynolds decision was framed as the guarantee of equal representation. The optimization it enabled was never part of that frame.

    The instrument gets built

    For twenty years after Reynolds, the gerrymander was still a manual operation. A consultant working with paper maps, census tables, and pencil calculations could produce a distorted district — Elbridge Gerry had managed that in 1812 with a salamander-shaped district in Massachusetts — but the distortion had friction. A human draftsman could only draw and compare so many maps in a single redistricting cycle. You could engineer a district. You couldn’t engineer a state.

    The friction disappeared in stages.

    During the 1980s, redistricting moved from paper to computerized databases. Demographic data, voter registration records, past electoral results — all of it digitized, all of it sortable. By the 1990s, Geographic Information Systems software — GIS — running on desktop computers could layer all of that information over census geography and reconfigure it in real time. Racial composition, income levels, party registration, precinct-level vote history: visible, sortable, mappable at the city-block level.

    The software that became the industry standard was called Maptitude for Redistricting, built by Caliper Corporation. It turned what had been a drafting problem into an optimization problem. A redistricting consultant could now generate thousands of legally compliant maps — every one meeting the Reynolds equal-population standard — and select the most advantageous one from the pool.

    The precision Reynolds required, GIS delivered. The reform and the instrument arrived together.

    The room where it happened

    By the time the 2010 redistricting cycle arrived, the setup was complete. Thirty years of GIS development had produced software capable of engineering a map at the census-block level — the smallest unit of population data the federal government produces, sometimes fewer than a hundred people. Reynolds had made equal population the floor. Maptitude had made everything above the floor available for manipulation.

    The people who used it knew exactly what they were doing. In 2011, Republican redistricting operatives in Wisconsin barricaded themselves in a law firm — they called it the Map Room — with Maptitude running on their laptops and non-disclosure agreements signed before anyone walked in. Legislators were brought in one at a time to see their new districts. They were not allowed to take the maps with them when they left.

    That is not politics as usual. That is a precision instrument operated in secret. The variable being optimized was never just which party wins. It was which specific incumbents would sit on which specific committees — Natural Resources, Agriculture, Energy and Commerce, the Interior appropriations subcommittee — and what those committees would do with a decade of uncontested control.

    Reynolds v. Sims established that your vote has to count equally. It did not establish that the lines around your district have to be drawn fairly. That gap — between the principle and the enforcement — is where the precision instrument lives.

    The next article shows what happened when someone picked it up at industrial scale.

    Your district has a score. Most people have never seen it.

    Your district’s partisan fairness grade, efficiency gap score, and competitiveness ratinghttps://gerrymander.princeton.edu
    An interactive map showing the demographic and partisan composition of your district, with tools to draw alternativeshttps://davesredistricting.org

    Sources

    1. Reynolds v. Sims, 377 U.S. 533 (1964). https://supreme.justia.com/cases/federal/us/377/533/

    2. Wesberry v. Sanders, 376 U.S. 1 (1964). https://supreme.justia.com/cases/federal/us/376/1/

    3. Justice Harlan dissent. Reynolds v. Sims at 589–625. https://supreme.justia.com/cases/federal/us/377/533/

    4. Alabama 1900 districts in use until 1964. Baker v. Carr, 369 U.S. 186 (1962). https://supreme.justia.com/cases/federal/us/369/186/

    5. Maptitude for Redistricting. Caliper Corporation. https://www.caliper.com/maptitude-for-redistricting/

    6. GIS adoption in redistricting 1980s–1990s. David Daley, Ratf**ked (2016). Liveright. Chapter 3. WorldCat: https://search.worldcat.org/title/923794434

    7. Wisconsin Map Room / NDA. David Daley, Ratf**ked (2016). Chapter 4.

    8. Gerrymandering origin — Elbridge Gerry 1812 Massachusetts. Boston Gazette, March 26, 1812. Library of Congress. https://www.loc.gov/resource/sn83045240/1812-03-26/

    Block 3, Article 1. © 2026 Steve Sagnotti.

  • What the Frozen Rooms Produced

    What the Frozen Rooms Produced

    Block 2, Article 4

    © 2026 Steve Sagnotti.

    The previous three articles documented two frozen rooms — how they were built, how the locks were installed, why neither can fix itself. The question this article answers is simpler: what were they protecting?

    The room that already knew

    The people who froze the House in 1929 were not operating in ignorance. The conservation argument had been made, published, and institutionalized for thirty years before they voted.

    By the 1890s the evidence of depletion was already visible. Wild turkey populations had fallen from approximately 10 million to 200,000. Elk from 10 million to 100,000. Theodore Roosevelt and Gifford Pinchot spent the first decade of the 20th century building a federal conservation apparatus — the Forest Service, the national parks, the Antiquities Act — explicitly premised on the recognition that the old abundance frame was wrong.

    Pinchot named it directly in 1910, in The Fight for Conservation: “As a people, we have been in the habit of declaring certain of our resources to be inexhaustible. To no other resource more frequently than coal has this stupidly false adjective been applied.” He was not speaking only of coal. The same chapter named soil waste, forest denudation, and water loss as compounding crises in progress.

    The members of Congress who voted to freeze the House nineteen years later had lived through all of it. The finite nature of the commons was not a secret. The freeze did not happen because the political class still believed the continent was inexhaustible. It happened because a reapportioned, urban-majority House would eventually revisit the legal architecture that protected below-market extraction rates — and the people in the room in 1929 knew it.

    The freeze was not ignorance. It was a decision made by people who already knew what Pinchot had said and chose to protect the arrangement anyway.

    What a frozen room will not do

    The record of what the frozen room protects is not theoretical. It is current and specific.

    In March 2025, Representative Bruce Westerman of Arkansas — Chair of the House Natural Resources Committee — made his first stock purchases since entering Congress in 2015. He bought approximately $1.6 million in oil and gas company shares: BP, ConocoPhillips, ExxonMobil, Shell.

    Two months later, his committee advanced the reconciliation package that became the One Big Beautiful Bill Act, signed July 4, 2025. The bill cut coal royalty rates from 12.5 percent to 7 percent through 2034. It rolled back oil and gas royalty rates from 16.67 percent back to 12.5 percent — the rate set in 1920. It mandated quarterly lease sales on federal lands. It rescinded old-growth forest protection funding.

    Wyoming produces the majority of the nation’s federal coal and receives approximately half of federal coal royalty payments. The royalty rate cut will cost Wyoming an estimated $50 million annually. State lawmakers said they were blindsided. One noted: “If in fact this Big Beautiful Bill is going to cost us $50 million, I know that was not the intent.”

    It was the intent. The room that voted for it is composed of 435 members serving an average of 747,000 constituents each, drawn into districts by legislatures that had no compactness requirements to follow, funded by industries whose rates the committee chairs are simultaneously trading. The mining royalty has stood at zero since 1872. The grazing fee is frozen at 1966 levels. The oil royalty just went back to 1920. The room will not revisit these arrangements. Not cannot. Will not.

    Westerman disclosed the trades under the STOCK Act. The fine for late disclosure: $200. Less than a good dinner out. The trade: $1.6 million.

    The federal deficit in 2025 was $1.8 trillion. The Congressional Budget Office projects the national debt will reach $56 trillion by 2036. When that debt is invoked as the reason nothing can be funded — no infrastructure, no social programs, no investment in what the public needs — the answer is not complicated. The deficit is framed as a spending problem: programs to cut, benefits to trim, entitlements to means-test. The revenue the government never charged for the public’s own resources doesn’t show up in that frame. The 1872 Mining Law charges zero royalty on federal hardrock minerals. The oil and gas royalty just went back to 12.5 percent, half of what Texas charges on its own state lands and less than what Alaska charges on North Slope production. Texas and Alaska are the two largest oil-producing states in the country. Both charge more than the federal government for extracting resources from land they own. The comparison is not ideological. It is accounting. The grazing fee is $1.69 per animal unit month against a market rate of over $23. The spectrum given to broadcasters at no charge for sixty-five years was worth an estimated $200 billion. Charge market rates on the public’s resources and the revenue exists. The room will not do it. The room that created the deficit by protecting the giveaways is the same room that points at the deficit to justify not fixing them.

    The nail

    The chain from 1929 to 2025 is not a series of coincidences. It is a single mechanism running forward.

    Benjamin Franklin published the verse in Poor Richard’s Almanack in 1758: For want of a nail the shoe was lost. For want of a shoe the horse was lost. For want of a horse the rider was lost. For want of a rider the battle was lost. For want of a battle the kingdom was lost. And all for the want of a horseshoe nail.

    The compactness requirements dropped in the same 1929 act that froze the House — barely noticed, never debated separately, never restored — compounded into ninety-five years of engineered maps. The maps compounded into locked committees. The locked committees compounded into royalty rates that have not been revised in over a century. The royalty rates compounded into the depletion documented in Block 10. The aquifer dropping a foot a year compounded into the communities already drilling deeper and finding less.

    Each link looked manageable at the time. The compactness requirements were procedural housekeeping. Congress set the 1920 royalty rate at what seemed like a reasonable number. The first congressional hearing on reapportionment went nowhere, and then the next one, and then the question stopped being asked for sixty years.

    The shoe was not lost when the nail fell out. The shoe was lost after the horse had traveled some distance on a shoe working itself loose. By the time anyone noticed, the sequence was already running. Pinchot had named it in 1910. The people in the room had read him. They froze the room nineteen years later.

    That is what the frozen rooms produced: not dysfunction. A result. Specific, compounding, and — for the people the room was built to serve — entirely predictable.

    The Frozen Room — Verification

    These questions can be answered with public records. The links are live.

    The royalty rate the federal government charges for coal, oil, and gas extracted from public landhttps://www.blm.gov/programs/energy-and-mineralsWhy is the federal rate lower than what Texas and Alaska charge on their own state land?
    Your representative’s stock holdings and recent tradeshttps://disclosures.house.govDid they hold energy industry positions when they voted on the One Big Beautiful Bill royalty provisions?
    The size of your congressional district versus the founding standardhttps://www.census.gov/topics/public-sector/congressional-apportionment.htmlDo they support the Wyoming Rule — expanding the House so no district exceeds the population of the smallest state?

    Sources

    1. Gifford Pinchot. The Fight for Conservation. 1910. Chapter I. https://www.gutenberg.org/files/11238/11238-h/11238-h.htm — Verified primary source.

    2. Wildlife population figures — wild turkey 10M → 200K; elk 10M → 100K by 1890. PERC, June 2019. https://www.perc.org/2019/06/06/the-north-american-model-of-wildlife-conservation/

    3. Westerman stock purchases — $1.6M in BP, ConocoPhillips, ExxonMobil, Shell, March 2025. Arkansas Times, May 9, 2025 (paywall). HuffPost/Public Domain, May 12, 2025. https://publicdomain.media/p/bruce-westerman-stocks

    4. One Big Beautiful Bill Act. H.R. 1, P.L. 119-21. Signed July 4, 2025. BLM press release July 22, 2025: https://www.blm.gov/press-release/interior-department-announces-actions-implement-one-big-beautiful-bill

    5. Wyoming $50M annual coal royalty revenue loss. Wyoming Public Media, August 15, 2025. https://www.wyomingpublicmedia.org

    6. STOCK Act $200 fine. 5 U.S.C. app. § 101 et seq. https://www.congress.gov/bill/112th-congress/senate-bill/2038

    7. Federal deficit FY2025 — $1.8 trillion. CBO Monthly Budget Review: Summary for Fiscal Year 2025, November 2025. https://www.cbo.gov/publication/61307

    8. CBO national debt — $56 trillion by 2036. CBO, “The Budget and Economic Outlook: 2026 to 2036,” February 11, 2026. https://www.cbo.gov/publication/62105

    9. Texas oil royalty rate on state land — 25%. Texas GLO Oil & Gas Royalty Reporting Manual. https://rrac.glo.texas.gov/assets/forms/instructions/oil-and-gas-reporting-manual.pdf

    10. Alaska North Slope royalty rate — 16.67% (Beaufort Sea / North Slope North Sub-Region). Alaska DNR, Division of Oil & Gas, 2025 Areawide Lease Sale Notice. https://aws.state.ak.us/OnlinePublicNotices/Notices/View.aspx?id=221056

    11. General Mining Law of 1872 — zero royalty on hardrock minerals. 30 U.S.C. § 21 et seq. https://uscode.house.gov/view.xhtml?path=/prelim@title30/chapter2&edition=prelim

    12. BLM Grazing Fee 2026 — $1.69/AUM. https://www.blm.gov/press-release/blm-usda-forest-service-announce-2026-grazing-fees — USDA NASS private rate $23+: https://www.nass.usda.gov/Statistics_by_Subject/index.php?sector=ECONOMICS

    13. Spectrum $200B estimate. CTIA / Broadband Breakfast, February 8, 2024. https://broadbandbreakfast.com/potential-200-billion-loss-for-u-s-economy-without-global-spectrum-harmonization-report/ — Note: figure represents projected economic cost of spectrum misalignment, not historical valuation of broadcaster licenses.

    14. Franklin, Benjamin. Poor Richard’s Almanack, 1758. Historical record.

    Block 2, Article 4. © 2026 Steve Sagnotti.

  • The Other Frozen Room

    The Other Frozen Room

    Block 2, Article 3

    © 2026 Steve Sagnotti.

    The House freeze was a statute. Congress passed it in 1929 and could repeal it tomorrow with a simple majority vote. What the previous two articles documented is a political problem — a room that will not fix itself because the people who benefit from the problem are the people who would have to fix it.

    The Senate is something else. The Senate’s malapportionment is not a statute. It is not a rule or a regulation or a procedure that a majority can change. It is in the Constitution. And the mechanism that would allow it to be changed is controlled by the states whose power depends on it staying broken.

    Same mechanism. Different origin. Neither moves.

    The founders’ bad compromise

    Wyoming has 587,000 residents and two United States Senators. California has 39 million residents and two United States Senators. The ratio is 66 to 1. Both states have equal weight in the chamber that confirms Supreme Court justices, ratifies treaties, and must pass every law before it reaches the president’s desk.

    Madison knew this was wrong before the Constitution was ratified. He called equal Senate representation “an evil” that the large states had accepted as the price of union. He was not being rhetorical. The Senate structure violated the fundamental democratic principle he had spent the convention arguing for — that legislators represent people, not states, not trees, not acres. He lost the argument by one vote. The Connecticut Compromise passed on July 16, 1787, fixing the Senate at two seats per state regardless of population. The union would not have formed otherwise. That is the honest account. The price was permanent minority veto over majority will in the upper chamber of the national legislature.

    In 1964, the Warren Court fixed this everywhere it legally could. Reynolds v. Sims held that both chambers of every state legislature had to be apportioned by population — one person, one vote. California’s state senate went from representing six million people with one senator to thirty-nine districts of equal population. The principle was clear, and every state applied it. The federal Senate was explicitly carved out. The Court could not touch it. The same democratic principle that restructured every other deliberative body in America was constitutionally prohibited from reaching the one whose structure is written into Article V with its own protection clause: no state shall be deprived of its equal suffrage in the Senate without its consent.

    A constitutional amendment requires ratification by three-fourths of states. Small states will not vote to dilute their own amplification. The founders’ bad compromise is the only founding compromise with a self-perpetuating protection clause built in.

    Equal Senate suffrage is framed as protection for small states against large ones. Which small states would end up holding that protection, and what industries they’d be protecting along with themselves, was never part of the frame.

    How the lock was built

    That protection clause did not end up in the Constitution by accident. Roger Sherman of Connecticut proposed the Great Compromise on July 16, 1787. The large states accepted it as the price of union, by a single vote. What they did not fully reckon with was what Sherman did next.

    During the debate on Article V — the amendment process — Sherman immediately moved to make equal Senate representation permanently unamendable. Madison recorded his words: Sherman “expressed his fears that three fourths of the States might be brought to do things fatal to particular States, as abolishing them altogether or depriving them of their equality in the Senate.” The protection clause was inserted. No state, without its own consent, could ever be deprived of its equal suffrage in the Senate.

    The same man who designed the compromise also locked it against reversal in the same convention. The large states thought they were compromising on the Senate to secure the proportional House. The small states got the equal Senate, got it constitutionalized, got it made unamendable, and got the amendment process itself structured to require their consent before anything could change. Delaware had arrived at the convention having already been instructed by its state commissioners not to agree to any deviation from equal state suffrage under any circumstances. They were not negotiating. They were collecting.

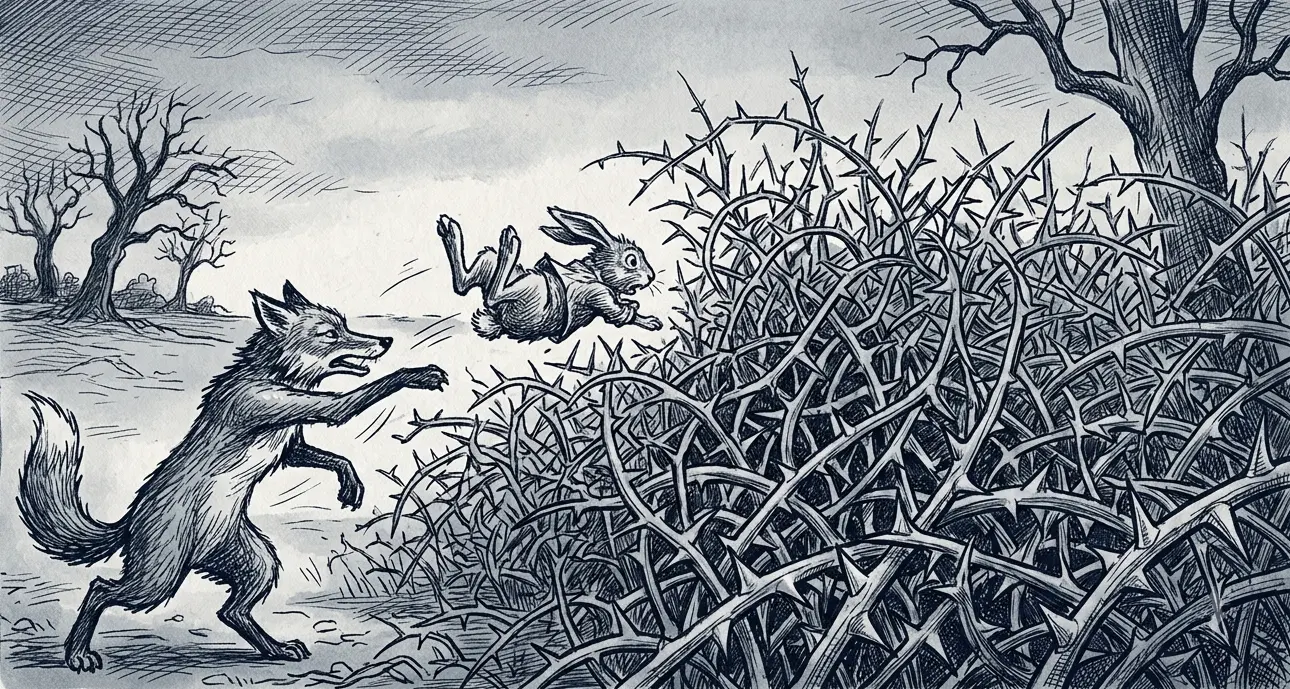
    The rabbit proposed the brier patch, got the bear to agree to it, and built a fence around it while the bear was still congratulating himself on the deal.

    What was built on top

    The Senate’s malapportionment was the original defect. The filibuster is what was built on top of it.

    The filibuster is not in the Constitution. Hamilton argued explicitly against supermajority requirements for ordinary legislation in Federalist No. 22 — such a rule, he wrote, gives a minority a negative over the majority, inverts the principle of majority rule, and “tends to subject the sense of the greater number to that of the lesser.” The Senate’s original rules required only a simple majority to close debate. In 1806, the Senate accidentally removed its majority-cloture rule during a housecleaning of procedures deemed redundant. No one noticed for decades. Extended obstruction emerged slowly and was used rarely through the first half of the twentieth century. In 1917 the Senate adopted Rule XXII — the first formal cloture rule — requiring a two-thirds supermajority to close debate. In 1975 it was reduced to three-fifths, the current 60-vote threshold.

    What happened next is in the numbers. From 1917 to 1970 — fifty-three years — the Senate filed cloture motions a total of 58 times. From 2010 to 2020 alone: over 600. The filibuster evolved from a rare procedural exception into the de facto operating requirement for all major legislation. The malapportioned chamber became a 60-vote supermajority lock. A minority of senators representing a minority of the American population can now block any legislation indefinitely, without speaking, without holding the floor, without doing anything at all except signaling the intent to obstruct.

    The two defects compound each other. The senators who most reliably deploy the filibuster represent states whose combined population is smaller than some individual cities. The chamber that Hamilton warned against has become precisely what he warned against — a constitutional instrument for minority veto over majority will, enforced by a procedural rule no one voted for, in a room no amendment can reach without the consent of the states who benefit most from leaving it exactly as it is.

    The Senate’s malapportionment doesn’t just dilute population — it overweights the exact states whose economies depend most directly on extraction. Wyoming’s 587,000 residents already carry the same two votes as California’s 39 million. Montana (1.14 million), North Dakota (811,000), and Alaska (740,000) carry the same two votes too — and all four are home to the mining, oil, and gas operations the Mining Law’s five-dollar-an-acre claims and the federal government’s unrevised royalty formulas protect. Combined, the four states hold about 3.3 million people — fewer than live in Los Angeles County alone. Hardrock mining royalty reform has been introduced in nearly every Congress since the early 1990s and has never once cleared the Senate; the House actually passed a version in 2007, 244 to 116, and it still died there. The chamber doesn’t need fifty-one votes against it. It needs forty-one senators, from those four states and a handful of others, willing to let the filibuster do the rest.

    The tautology

    The Permanent Apportionment Act is a statute. Repeal it with a simple majority. Restore the compactness requirements in the same bill. The Senate’s equal suffrage is in the Constitution, but the filibuster is a Senate rule — it has been changed twice already, in 2013 and 2017, and could be changed again by a simple majority of senators present and voting. The same Senate that can’t pass royalty reform installs the judges who interpret the laws protecting it — and removed its own supermajority requirement to do exactly that, for judicial nominees in 2013 and for the Supreme Court in 2017. Block 7 documents what the Senate built once the filibuster stopped being in its way.

    On paper, the frozen rooms are fixable. On paper.

    The repair requires a majority vote in the House — the body whose members drew the districts that guarantee their own incumbency and have no structural incentive to redraw them. The repair requires a majority vote in the Senate — the body whose malapportionment gives small states veto power over any reform that would dilute their amplification. The repair requires a president willing to sign it. The repair requires that the people who benefit from the problem are willing to vote against their own interest to fix it.

    The mechanism that created ninety-five years of compounding damage is, on paper, the easiest kind of thing to fix.

    None of this was put to a public vote. The 1929 Act passed with no recorded public debate. The same bill dropped the compactness requirements without a separate vote or public notice. The filibuster evolved through procedural drift and was intensified by political calculation. The fence Sherman built in 1787 has no gate.

    The repair is a majority vote. The majority is composed of the people whose power depends on the problem staying in place.

    This is not dysfunction. It is the system working as designed.

    Sources

    1. Wyoming / California / Montana / North Dakota / Alaska population. U.S. Census Bureau, Vintage 2025. https://www.census.gov/programs-surveys/popest.html — FRED: https://fred.stlouisfed.org

    2. Los Angeles County population 2025. U.S. Census Bureau. https://data.census.gov/table/DECENNIALPL2020.P1

    3. Madison “evil” quote on Senate equality. Notes on the Constitutional Convention / Farrand, Records Vol. 1. https://founders.archives.gov/documents/Madison/01-10-02-0044

    4. Reynolds v. Sims, 377 U.S. 533 (1964). https://supreme.justia.com/cases/federal/us/377/533/

    5. Article V equal suffrage protection. U.S. Constitution. https://constitution.congress.gov/constitution/article-5/

    6. Sherman Connecticut Compromise / Article V motion. Founders Archives / Madison Papers. https://founders.archives.gov/ — Delaware instructions: Farrand, The Framing of the Constitution (1913). Congress.gov Constitution Annotated: https://constitution.congress.gov/browse/article-1/section-3/clause-1/

    7. Hamilton on supermajority requirements. Federalist No. 22. Avalon Project. https://avalon.law.yale.edu/18th_century/fed22.asp

    8. Senate Rule XXII / filibuster history. Senate Historical Office. https://www.senate.gov/about/powers-procedures/filibusters-cloture.htm

    9. Cloture motion counts — 58 in 53 years (1917–1970); 600+ in decade 2010–2020. U.S. Senate. https://www.senate.gov/legislative/cloture/clotureCounts.htm

    10. Hardrock mining royalty reform — H.R. 2262, 110th Congress, passed House 244–116, died in Senate. https://www.congress.gov/bill/110th-congress/house-bill/2262

    11. Filibuster changed 2013 (judicial nominees), 2017 (Supreme Court nominees). Senate Historical Office.

    Block 2, Article 3. © 2026 Steve Sagnotti.

  • One Act, Two Moves

    One Act, Two Moves

    © 2026 Steve Sagnotti.

    The 1929 Act is remembered as the moment Congress froze the House at 435. That is true. It is also the smaller part of what happened.

    The room had been arranged before

    The people who froze the House in 1929 had been arranging the room for forty years. In 1888, with Democrats controlling the House and the presidency, four territories sat waiting for statehood: Dakota, Montana, Washington, and New Mexico. Democrats proposed admitting all four together — the math would balance, since two were expected to vote Republican and two Democratic. Then Republicans won the 1888 election. The compromise disappeared.

    What happened next took nine months. Republicans admitted six states in a single accelerated push. Republicans split the Dakota Territory in two. North Dakota, South Dakota, Montana, Washington, Idaho, and Wyoming were all admitted between 1889 and 1890, sending twelve Republican senators to the 51st Congress. New Mexico — expected to produce Democratic senators — waited 23 more years. Arizona waited with it. Republicans held both out until 1912, then admitted them as a matched pair that neutralized each other’s partisan effect.

    The people who froze the House in 1929 had watched their predecessors pack the Senate with six states in nine months to lock in a majority. They understood what a room looked like when it was arranged in your favor. They arranged one.

    What the 1929 Act actually did

    The fight over reapportionment ran for the entire decade of the 1920s. Rural members introduced bills to expand the House enough that no state would lose a seat. Urban members wanted proportional growth. Neither side could agree. The decade ended with both sides exhausted — and with one side holding more leverage than the other.

    The Permanent Apportionment Act passed in June 1929. It did two things. The first was visible: it froze the House at 435 and created an automatic reapportionment mechanism so the census fight would never happen again. The second was quiet.

    Every apportionment statute from 1842 through 1911 — every one, without exception, for 87 years — had required that congressional districts be contiguous, compact, and equally populated. Contiguous meant a district had to be a single connected piece of geography. Compact meant it had to be roughly proportional in shape — no salamanders, no tentacles reaching across counties to pick up a favorable precinct. Equal population meant districts within a state had to be roughly the same size. These three requirements were the structural constraints that made extreme district manipulation difficult. You cannot effectively gerrymander a district required to be compact.

    The 1929 Act dropped all three. Not inadvertently — the legislative record makes clear it was deliberate. Congress in 1929 did not simply decide to stop growing the House. In the same session, it removed the rules that had constrained how the existing House would be drawn. The freeze and the removal of guardrails were the same legislative act, passed by the same people in the same room, with the same vested interest in the outcome.

    Congress framed the 1929 Act publicly as a population-counting fix — a technical reapportionment formula, settled and procedural. The repeal of compactness, contiguity, and equal-population requirements rode through in the same bill, framed as nothing in particular. It was never debated as its own question, because raising it as one would have required admitting what it was for.

    The freeze is the story everyone tells. The dropped requirements are the mechanism that let the freeze compound into something worse.

    Ninety-five years of gerrymandering — the salamanders, the packing and cracking, the maps that convert minority popular votes into supermajority legislative control — flows from that second, quieter decision.

    The 1959 exception that proved the rule

    The freeze was not absolute. In 1959, when Alaska and Hawaii achieved statehood, Congress temporarily expanded the House to 437 to provide the new states with representation. The expansion was explicit and intentional. It was also explicitly temporary.

    The 1929 Act’s automatic reapportionment mechanism was still running. After the 1960 census, the math recalculated. The two new seats disappeared into the algorithm, and the House settled back to 435 in 1963. Congress had not repealed the 1929 framework. The framework had simply done what it was designed to do: absorb the exception and restore the cap. The room closed around the new members and went back to its permanent number.

    The question that was never answered

    The Permanent Apportionment Act has never been fully tested against Article I, Section 2 of the Constitution, which requires that apportionment reflect population. In 2024, a constitutional challenge — Schroeder v. United States — reached the Supreme Court making exactly that argument. The Court denied certiorari in October 2024. Not on the merits. On jurisdiction. The constitutional question whether the 1929 Act violates the Constitution’s apportionment requirement remains formally unresolved.

    The case did not fail. It was not heard. The difference matters. A case that fails on the merits produces a ruling. A case denied on jurisdiction produces silence. The argument that the frozen House violates the document it was built to serve has not been answered. It has been deferred.

    What the two moves produced together

    The freeze made every seat more valuable. A House that cannot grow means any seat gained is a seat taken from someone else — which means the stakes of drawing the map go up every decade. The removal of compactness requirements made aggressive map-drawing legally available. Together: higher stakes, no rules. The result was not a coincidence. It was geometry.

    The Mining Law of 1872 still charges zero royalty on federal minerals. The grazing fee frozen at 1966 levels still runs at $1.35 per animal unit month against a market rate of $23. The spectrum licenses given to broadcasters for six decades were never billed. These arrangements survived because the room that would have revised them was too diluted to act, drawn into districts that guaranteed the votes of the members who set and protected the rates. The freeze and the rigged map are one mechanism. The rates they protected are still running.

    The dropped compactness requirement is also the direct ancestor of the engineered maps that follow. Block 3 shows what got drawn once the only rule constraining the shape of a district disappeared.

    The same 1929 act that froze the House also eliminated the 87-year-old rules that prevented extreme gerrymandering — in the same session, by the same people, without public debate.

    Sources

    1. North/South Dakota, Montana, Washington, Idaho, Wyoming admitted 1889–1890. U.S. Senate Historical Office. https://www.senate.gov/artandhistory/history/minute/Admission_of_New_States.htm

    2. Permanent Apportionment Act of 1929. Pub.L. 71-13. https://www.congress.gov/bill/71st-congress/house-bill/11

    3. Apportionment requirements 1842–1911. Act of June 25, 1842, Ch. 47 — contiguity, compactness, equal population required; dropped in 1929 Act. https://www.congress.gov/bill/27th-congress/house-bill/9

    4. Wood v. Broom, 287 U.S. 1 (1932) — confirmed 1929 Act’s requirements governed existing districts. https://supreme.justia.com/cases/federal/us/287/1/

    5. Alaska/Hawaii statehood 1959 / temporary expansion to 437. U.S. House Historical Highlights. https://history.house.gov/Historical-Highlights/1951-2000/Alaska-and-Hawaii-Statehood/

    6. Schroeder v. United States, No. 23-1331. Certiorari denied October 7, 2024. https://www.supremecourt.gov/search.aspx?filename=/docket/docketfiles/html/public/23-1331.html

    7. Montana disputed election — Senate voted 32–26 to seat Republican credentials. U.S. Senate Historical Office — Montana State Timeline. https://www.senate.gov/states/MT/timeline.shtml — Confirmed from Senate.gov: “On April 16, the Senate voted 32 to 26 to seat the Republicans.”

    8. General Mining Law of 1872 — zero royalty on hardrock minerals. https://uscode.house.gov/view.xhtml?path=/prelim@title30/chapter2&edition=prelim

    9. BLM Grazing Fee 2026 — $1.69/AUM. https://www.blm.gov/press-release/blm-usda-forest-service-announce-2026-grazing-fees — USDA NASS private rate $23+: https://www.nass.usda.gov/Statistics_by_Subject/index.php?sector=ECONOMICS

    Block 2, Article 2. © 2026 Steve Sagnotti.

  • When Did Congress Stop Representing the Country?

    When Did Congress Stop Representing the Country?

    Block 2, Article 1

    © 2026 Steve Sagnotti.

    The founders were explicit about this. James Madison wrote Federalist No. 58 specifically to address the fear that the House of Representatives would stop growing with the population. He titled it “Objection That The Number of Members Will Not Be Augmented as the Progress of Population Demands Considered” and argued that the constitutional design made perpetual growth inevitable. The “unequivocal objects” of the census and reapportionment mechanism, he wrote, were “to readjust, from time to time, the apportionment of representatives to the number of inhabitants… and to augment the number of representatives.” George Washington’s only recorded intervention in the Constitutional Convention debates was to push for smaller districts — one representative per 30,000 constituents. The founders projected 400 representatives by 1838, more than 600 by 1887. The House was designed to grow forever.

    It stopped.

    The frontier closes, the majority arrives

    For three centuries, westward expansion defined American political identity. New territories became states. States sent new representatives. The room grew with the country. From 1790 through 1911, the House grew after every single census — thirteen reapportionments, thirteen expansions, 65 seats to 435 over 130 years. Every time the country grew, the room grew with it.

    Then the map filled in. Oklahoma achieved statehood in 1907. New Mexico and Arizona followed in January and February of 1912 — the last two contiguous states, completing the lower 48. The continental frontier was formally closed in law and geography just eight years before the census that changed everything.

    The 1920 census was the first in American history to show that more than half the United States population lived in cities. What that meant for Congress was arithmetic: a constitutionally required reapportionment would transfer seats from rural states to urban ones. Rural incumbents faced losing power not through any election — not because voters had chosen otherwise — but because Americans had moved. Urban members faced a different but equally unwelcome prospect: more colleagues meant less individual influence. A larger House means smaller districts, less money per race, and a thinner slice of committee power for every member already holding it. The primary motive was rural retention. The secondary motive was something every member in every safe district understood: a smaller room is an easier room to control — and an easier room to buy. Every new seat is a new relationship the donor class has to purchase. Freeze the room at 435 and the price of capture stays fixed while the country grows around it.

    So they simply did not reapportion. The House failed to act on the 1920 census — the first and only time Congress defied the constitutional reapportionment requirement while the House was still designed to grow. The 1929 Act ended that design. After 1929, there was nothing left to defy. The seats just move between states. The total stays fixed. The 1910 seat distribution stayed in effect until 1933 — a full decade of congressional sessions, running on numbers the Constitution required Congress to update.

    It was not chaos or dysfunction that produced this outcome. It was the ordinary logic of people in a room who shared a common interest in the result.

    The freeze and what it produced

    In 1929, Congress acted — not to reapportion, but to ensure no reapportionment could threaten incumbency again. The Permanent Apportionment Act froze the House at 435 members, the number it happened to be after the 1910 census. No constitutional amendment. No referendum. No public debate on record. The people whose representation was being permanently restructured were not asked.

    Madison had promised this was impossible. The people in the room decided otherwise.

    The arithmetic consequence has been compounding ever since. Wyoming today has 587,000 people and one House representative. Montana has 1.1 million people and one House representative. Both states have the same voice in the people’s chamber. A Montana voter’s House vote is worth roughly half of a Wyoming voter’s — not because of anything either state did, but because the math froze in 1929 and the fractions fell differently. The national average has moved from 30,000 constituents per representative at the founding to 747,000 today — the highest ratio in American history, and by far the highest of any industrialized democracy. That is a 25-fold dilution. It is not drift. It is arithmetic.

    In the immediate aftermath, a handful of rural-state members tried to restore the old logic — introducing bills in the early 1930s to raise the cap just enough that no state would lose a seat. Those bills were buried in committee before the decade was out. The Depression shifted every agenda. And then, for roughly sixty years, the question of whether the House should grow with the country essentially disappeared from Congress. Not defeated. Not debated and voted down. Simply not raised. The 1929 statute was treated as if it were written into the Constitution itself, despite being an ordinary federal law that a simple majority could repeal any Tuesday.

    The objection you hear most often is physical: where would they all sit? The Capitol Building itself answers this. The current House Chamber — opened in 1857, built specifically because a growing Congress needed more room — seats 448 members. There are 435. The chamber was built for more representatives than currently use it. Every time before 1929 that Congress outgrew its room, they built a bigger one. After 1929, they decided the room was fine.

    Congress framed the freeze in 1929 as a question of practical capacity — how many members a chamber could hold, how large a deliberative body could function. Whether the chamber’s composition still represented the country was never raised as the question it actually was.

    What came with the freeze

    The founders never intended 747,000 constituents per representative. They also never intended what came next.

    The same generation that watched the frontier close also understood that a proportional House would have every reason to revisit the legal architecture built for a world of inexhaustible abundance. The below-market royalty rates on federal minerals, set in 1920. The grazing fees frozen at 1966 levels. The spectrum licenses given free to broadcasters for six decades. These arrangements required a room too diluted to challenge them. The freeze delivered that room. It has been delivering it ever since.

    The room that votes to keep itself frozen is the same room that draws its own district lines without restraint. What that power built is Block 3.

    The United States Congress has a lower ratio of representatives to constituents than any other major democracy in the world.

    The founders wrote a guarantee. The room they were guaranteeing ignored it.

    Sources

    1. Madison, James. Federalist No. 58. February 20, 1788. Avalon Project, Yale Law School. https://avalon.law.yale.edu/18th_century/fed58.asp

    2. U.S. House — Permanent Apportionment Act of 1929. https://history.house.gov/Historical-Highlights/1901-1950/The-Permanent-Apportionment-Act-of-1929/

    3. U.S. House — 1911 Reapportionment. https://history.house.gov/Historical-Highlights/1901-1950/Reapportionment-Act-of-1911/

    4. American Academy of Arts & Sciences. “The Case for Enlarging the House.” https://www.amacad.org/ourcommonpurpose/report

    5. 1920 census first majority-urban. U.S. Census Bureau. https://www.census.gov/history/www/through_the_decades/index_of_questions/1920_1.html

    6. Wyoming 587,000 / Montana 1.1 million. U.S. Census Bureau, 2020. https://data.census.gov/table/DECENNIALPL2020.P1

    7. 747,000 constituents per representative. Pew Research Center, May 2018. https://www.pewresearch.org/short-reads/2018/05/31/u-s-population-keeps-growing-but-house-is-same-size-as-in-taft-era/

    8. Member-dilution motive. Bloomberg, May 2021 (paywall) — “Lost N.Y. House Seat Stirs Echoes of Racist 1929 Congress Debate.”

    9. House Chamber 448 seats. Architect of the Capitol. https://www.aoc.gov/explore-capitol-campus/buildings-grounds/capitol-building/house-wing/chamber

    10. 1930s “Stop the Loss” bills. American Redistricting Project, October 2025. https://thearp.org/documents/capping-the-house/

    Block 2, Article 1. © 2026 Steve Sagnotti.

  • The Legal Architecture in Operation

    The Legal Architecture in Operation

    Block 1, Article 5

    © 2026 Steve Sagnotti.

    Congress resolved the problem of a resource that doesn’t respect property lines back in 1872 — in favor of whoever got there first. The rule is still on the books.

    In Dimock, Pennsylvania, a resident turned on the kitchen tap in 2008 and the water caught fire. He called Cabot Oil & Gas, which had drilled and fracked 62 wells in the nine-square-mile area around this town of 1,500 people. He was told to flee in case his house exploded. The Pennsylvania Department of Environmental Protection investigation that followed found contamination in 19 homes on Carter Road alone. Residents drove long distances to buy bottled water. Some fetched it from an artesian well miles away. A water buffalo — a portable tank — was parked on the road. The EPA opened an investigation, sampled roughly 60 households, reported no immediate danger, and closed the investigation.

    The company, now called Coterra Energy, denied responsibility for fourteen years and then, in November 2022, pleaded no contest to criminal environmental charges. The settlement included $16.29 million toward a public water system for Dimock’s 1,200 residents — the first one the town has ever had. Construction of that system is ongoing. Coterra is still drilling.

    What the family in Dimock did not know when they moved there, and what most Americans do not know about land they have owned for generations, is that the ground beneath their feet may not belong to them. The deed says one thing. The law says another.

    The vein runs where it runs

    Congress wrote the General Mining Law of 1872 to solve a specific problem. Gold and silver veins do not follow property lines. A vein that apexes — surfaces — on one claim may run laterally beneath a dozen neighboring claims. In the early decades of western mining this produced constant litigation and occasional violence. Congress resolved it with a doctrine called the apex law: whoever holds the claim where a vein surfaces — its apex — owns the right to follow that vein wherever it runs beneath the earth, including under a neighbor’s claim. The right travels with the apex, not with whoever happens to reach a given stretch of ore first. And if two claims turn out to be working what later proves to be the same vein, the claim holding the apex takes precedence over the entire vein — even the portions a neighboring claim had already been mining as if it were their own.

    F. Augustus Heinze — a mining engineer who understood the law as well as the geology — proved what this meant in practice. He acquired tiny triangular slivers of surface land near Anaconda Copper’s claims in Butte, Montana. Some were less than 400 square feet — the footprint of a 20-by-20-foot room. Under apex law, those slivers’ surface contact with a vein gave Heinze the right to follow it wherever it ran — including deep into shafts Anaconda had spent millions to build. Courts built three-dimensional models of Butte’s vein systems to determine where each vein first broke the surface. While the litigation ran, Heinze’s crews drilled crosscuts from his claims directly into Anaconda’s tunnels and extracted ore from shafts the other company had constructed. The legal right was the entry point. The physical extraction followed. The tunnels kept moving while the courts argued overhead. Anaconda eventually bought Heinze out — not because he lost, but because the litigation was cheaper to end than to win.

    The geological fiction at the heart of the apex law — that a vein is a discrete structure traceable from a single surface emergence to wherever it runs in the earth — was not scientifically supportable even in 1872. But the legal right is real, and it is still in effect.

    The land is yours. What’s under it isn’t.

    In 1916, Congress passed the Stock Raising Homestead Act. Homesteaders in the arid West received 640-acre allotments — twice the standard — because the land required more acreage to be viable for grazing. The federal government retained the mineral rights. The homesteader got the surface. The minerals stayed federal.

    Over the following decades, roughly 70 million acres passed into private surface ownership under the SRHA while the mineral estate remained federal. The federal government then leased that estate — under the 1872 Mining Law, open to any valid claimant — to operators the surface owner had no role in selecting. The surface owner had no right of first refusal. They were not offered the mineral estate when it was leased. They were not consulted when the lease was awarded. In 1993 — seventy-seven years after the SRHA passed — Congress amended the law to require that the surface owner be notified before an operator enters their land. The surface owner may request a convenient time. The surface owner may not prevent entry.

    The mineral estate is dominant. That is the legal term, and it means what it says. The most exposed party in this arrangement is not the original homesteader, who at least knew what they were signing. It is the buyer two or three transactions later — who purchased what looked like a ranch or a farm or a rural home site, whose title insurance excluded mineral rights in language buried in the exceptions schedule, and who discovered the gap only when a land crew showed up to begin survey work.

    Congress framed the 1872 law as an orderly system for resolving competing claims on public land. The zero-royalty rate, the no-cleanup obligation, and the right to follow a vein beneath a neighbor’s claim were not in the public description of the law’s purpose.

    The choice Congress made for coal — and the lease that never had to work

    In 1920 Congress created a leasing system for energy minerals — royalties, competitive bidding, revenue sharing with states. The minimum bid was set at two dollars an acre and stayed there for thirty-five years. More than a third of federal leases have sold at exactly the floor price with exactly one bid — a process the law calls competitive. A company can then hold a lease for years without producing anything, paying only a nominal annual rental fee, encumbering public land and foreclosing other uses while the public collects almost nothing. The lease sits on the corporate balance sheet as an appreciating asset — an option on a publicly owned resource held at public expense, gaining value as commodity prices rise, sellable or developable whenever the market reaches the number the company was waiting for. The original holder can also sell the lease to a third party at the appreciated market value before a single barrel is pumped, capturing the gain between the $2 acquisition price and the current value of the option, royalty-free, while the public that owns the underlying resource collects nothing on the transfer.

    A private landowner leasing mineral rights routinely prohibits assignment, requires development within a set timeframe, and mandates forfeiture for non-performance — standard protections any owner applies to a valuable asset. Federal mineral leases include none of these protections consistently. The lessee can assign. The timeline is extensible. Forfeiture is rare. The difference between the two arrangements is who wrote the lease and in whose interest.

    Congress had watched the railroad land grants and the homestead giveaways and decided that for energy minerals, the public ought to collect something from the extraction. The royalty rate it set was 12.5 percent — as established in Article 4. It did not extend the same logic to hardrock minerals — gold, silver, copper, uranium. Those remained governed by the 1872 Mining Law. Five dollars an acre for the claim. Zero royalty on what comes out. Cleanup costs go to the Superfund. The Superfund’s documented remediation need exceeds seventy-five billion dollars. Its annual appropriation is less than one billion.

    Congress knew how to build a royalty system. It built one for coal and oil in 1920 — and then framed the question of what the public was owed for hardrock mineral wealth as one the law had already answered in 1872. The answer was zero. It has not been revised in 153 years. The question has not returned to the floor.

    What the tradition knew

    The theological tradition the nation most loudly claims is specific about what inheritance requires. Genesis 2:15 does not say own the earth. It says tend it and keep it. The charge is stewardship, not title. The tradition didn’t hand it over to be liquidated. It handed it over to be maintained, improved, and passed forward to those who come after. This is not a loose cultural allusion. It is the foundational text of the tradition, read aloud at the sessions the nation opens with prayer, sworn upon at inaugurations, embossed on the currency.

    The commons this block documents was the inheritance. The fossil water, the mineral wealth deposited over geological time, the fisheries and forests and soil — these were not created by the industries that extracted them. They were created by geological time, biological process, and the management systems of the people who were here before the 1872 law was written. The Hebrew prophets who gave the tradition its moral core were not abstract about what violated the obligation. Isaiah named the specific sin: joining field to field until you are placed alone in the midst of the earth. The prophets were describing a particular operation: people with legal and political leverage taking the commons, and leaving everyone else with nothing. The tradition knew this operation. It named it.

    The legal architecture documented in this article — the zero-royalty claim, the split estate, the speculative lease, the choice Congress made for coal and withheld from hardrock — is the foundation every subsequent mechanism block was built to protect. The mechanism blocks that follow do not explain why extraction ran at below-market rates. They explain why the architecture that set those rates was never corrected.

    The nation that received this inheritance also received the obligation that came with it. The charge was not to maximize the extraction rate. The question the tradition raises is not whether the nation knew what it was receiving. It is whether it understood what receiving it required.

    Check This Yourself

    Active hardrock mining claims filed under the 1872 Mining Lawhttps://reports.blm.gov/reports/legacy/lrassist
    Whether your land carries a mineral reservationhttps://www.blm.gov/programs/lands-and-realty/title-and-records/master-title-plats

    Does the land you own — or land your family has owned — carry a mineral reservation? Check your deed’s chain of title back to the original patent. BLM master title plats are public record at your local BLM field office. If the land was homesteaded under the Stock Raising Homestead Act of 1916, the federal government retained the mineral rights. The answer is public record and costs nothing to find.

    Sources

    1. Pennsylvania DEP contamination / Dimock. Allegheny Front. https://www.alleghenyfront.org/pa-attorney-general-charges-cabot-oil-and-gas-with-environmental-crimes-in-dimock/ — DeSmog. https://www.desmog.com/2022/11/30/fracking-company-pleads-no-contest-in-iconic-water-contamination-case-in-dimock/

    2. Heinze / Butte apex law. The Verdigris Project. https://www.verdigrisproject.org/2021/11/butte-americas-story-episode-280-the-apex-law/

    3. SRHA / split estate. Earthworks. https://earthworks.org/issues/stock-raising-homestead-act/ — BLM. https://www.blm.gov/programs/energy-and-minerals/oil-and-gas/leasing/split-estate

    4. Competitive bidding / 37% single minimum bid. GAO-21-138. https://www.gao.gov/products/gao-21-138

    5. Federal lease assignment / diligence. 43 CFR Part 3100. https://www.ecfr.gov/current/title-43/chapter-II/subchapter-C/part-3100

    6. Superfund remediation gap. EPA CERCLA. https://www.epa.gov/superfund — CBO, “The Total Costs of Cleaning Up Nonfederal Superfund Sites,” January 1994: https://www.cbo.gov/sites/default/files/cbofiles/ftpdocs/48xx/doc4845/entirereport.pdf — $75B figure from CBO 1994 base-case scenario (lifetime cost projection). Annual appropriation < $1B (recent).

    7. Genesis 2:15; Isaiah 5:8. Hebrew Bible. No URL required.

    Block 1, Article 5. © 2026 Steve Sagnotti.

  • The Legal Frame

    The Legal Frame

    Block 1, Article 4

    © 2026 Steve Sagnotti.

    The abundance documented in the preceding articles needed a legal frame. The frame answered one question above all others: what does the public get in return for the use of what it owns?

    The answer was set in rooms the public never entered, at moments when the industries being asked to pay had maximum leverage over the people setting the price. The rates that resulted have not changed in decades — in some cases in a century and a half. The commodities they govern have increased in value by factors of ten, a hundred, a hundred and sixty. The rates have not moved. The gap between those two lines, compounded across decades and multiplied by volume, is the transfer this series documents.

    How the floors were set

    The General Mining Law of 1872 was written by the mining industry for the mining industry. It set the royalty rate for hardrock minerals — gold, silver, copper, uranium — extracted from federal land at zero. Not a low rate. Not a rate indexed to commodity price. Zero. An ounce of gold in 1872 was worth $20.67. An ounce of gold today is worth $3,200 to $3,500 — roughly 160 times its 1872 price. The royalty rate remains zero. The question of what the public was owed for the mineral wealth beneath its land was answered once, in 1872, in a room the public did not enter, and has not returned to the floor in 153 years.

    The oil and gas royalty rate of 12.5 percent was written into the Mineral Leasing Act in 1920, when gasoline cost 20 cents a gallon — one twentieth of its price today. It was not derived from an independent economic analysis of fair market return to the public. It was negotiated with the oil industry at a moment when the federal government was still building the basic architecture of public land management and the industry had significant influence over the outcome. Texas charges 25 percent on production from its own state lands for the same resource extracted from the same formations. Norway collects approximately 78 percent. The federal rate remained at 12.5 percent for a century, was briefly raised to 16.67 percent under the Inflation Reduction Act in 2022, and was rolled back to 12.5 percent by the One Big Beautiful Bill Act of 2025. The industry that benefits from the rate funds the legislative apparatus that sets it.

    The federal grazing fee was anchored to a 1966 base value and frozen by executive order in 1986. The 2026 federal grazing fee is $1.69 per animal unit month. The average private grazing lease across seventeen comparable western states runs over $23 per animal unit month. In real inflation-adjusted terms the subsidy has grown substantially while the nominal number stayed fixed. No vote was required. No legislation was passed. The rate simply was not adjusted as the dollar lost value, and the industries that benefit from it funded the people who would have adjusted it.

    In every case the rate was established at the moment of maximum industry leverage over the legislative process — before independent regulatory capacity existed to push back, before the public interest had organized itself to demand an accounting. And in every case the rate was then frozen, because the same industries that set it continued to fund the people who would have revised it. The market moved. The rates did not.

    What the public actually collects

    The royalty is calculated on two numbers the operator reports: how much was extracted and what it was worth at the wellhead. Both are self-reported with limited independent verification. The volume can be understated. The price can be manipulated. State and international producers have developed mechanisms that largely close these gaps — the details and the cost of the federal failure to do the same are what Block 10 documents.

    What the frame excluded

    Congress knew how to build a royalty system that reflected actual market value. It built one for coal and oil in 1920 and chose not to extend it to hardrock minerals. Texas has charged double the federal rate on its own land for generations and built a permanent school fund from the proceeds that has funded public education without a state income tax for over a century. Alaska built a sovereign wealth fund from oil royalties and sends every resident an annual dividend. Norway built the largest sovereign wealth fund in the world from petroleum royalties, now holding over two trillion dollars in trust for its citizens. The answers were not unavailable. They were outside the frame.

    The rates were framed as settled law, as historical precedent, as the only practical option given the constraints. What the frame excluded was the question of what the public was actually owed — and the evidence, in three jurisdictions managing the same resources, that a different answer was always available to anyone willing to ask it.

    The hinge

    Every mechanism block that follows documents one gear in the apparatus that has kept these rates where they are. The frozen House prevented the reapportionment that would have shifted political power toward the populations most affected by extraction. The rigged map ensured the congressional districts that set extraction policy remained in the hands of the people extraction policy benefits. The locked door kept the constituency that might have challenged the rates from building the political vehicle that could reach the room where rates are set. The captured bench ensured that legal challenges ran through a judiciary the extraction apparatus helped build.

    The legal frame documented in this article is what those mechanisms were built to protect. Block 1 has shown what existed before the frame arrived, how the settler frame misread it, how public investment extended it across two centuries, and how the legal architecture set the terms of its transfer at rates the industry set for itself. The mechanism blocks show how those terms were protected from revision. Block 10 shows the balance sheet.

    Sources

    1. General Mining Law of 1872. 30 U.S.C. § 22 et seq. Zero royalty on hardrock minerals. https://uscode.house.gov/view.xhtml?path=/prelim@title30/chapter2&edition=prelim

    2. Gold price 1872 — $20.67. U.S. Mint historical records. https://www.usmint.gov/learn/coin-and-medal-programs/historical-price-of-gold — Gold price 2026 — $3,200–$3,500: spot market.

    3. Mineral Leasing Act of 1920. 30 U.S.C. § 181 et seq. 12.5% royalty. https://uscode.house.gov/view.xhtml?path=/prelim@title30/chapter3A&edition=prelim — Gasoline price 1920, 20 cents. InflationData.com. https://inflationdata.com/articles/inflation-adjusted-prices/inflation-adjusted-gasoline-prices/

    4. Texas royalty rate 25% on state lands. Texas GLO Oil & Gas Royalty Reporting Manual: https://rrac.glo.texas.gov/assets/forms/instructions/oil-and-gas-reporting-manual.pdf — Norway effective rate ~78%. [S-24] Taxpayers for Common Sense. https://www.taxpayer.net

    5. Inflation Reduction Act 2022 — royalty raised to 16.67%. Pub.L. 117-169. https://www.congress.gov/bill/117th-congress/house-bill/5376 — [S-09] One Big Beautiful Bill Act 2025 — reverted to 12.5%. P.L. 119-21. BLM press release July 22, 2025: https://www.blm.gov/press-release/interior-department-announces-actions-implement-one-big-beautiful-bill

    6. BLM Grazing Fee 2026 — $1.69/AUM. https://www.blm.gov/press-release/blm-usda-forest-service-announce-2026-grazing-fees — USDA NASS private lease rate $23+: https://www.nass.usda.gov/Statistics_by_Subject/index.php?sector=ECONOMICS

    7. Texas Permanent School Fund. Texas Education Agency. https://tea.texas.gov/finance-and-grants/state-funding/additional-finance-resources/permanent-school-fund — Texas GLO: https://www.glo.texas.gov/energy-business/asset-management/permanent-school-fund

    8. Alaska Permanent Fund Corporation. https://apfc.org

    9. Norway Sovereign Wealth Fund. Norges Bank Investment Management. https://www.nbim.no — Current value (end-2025): 21,268 billion NOK ≈ $2.19 trillion USD. Update at publication.

    Block 1, Article 4. © 2026 Steve Sagnotti.

  • The Commons Kept Expanding

    The Commons Kept Expanding

    Block 1, Article 3

    © 2026 Steve Sagnotti.

    The physical commons documented in the first two articles — the land, the water, the forests, the soil — was the foundation. The country kept building on top of it. Not through private enterprise alone, but through deliberate public investment in knowledge, infrastructure, and science. The commons expanded into new forms across two centuries. The logic that transferred the physical commons to private hands ran alongside that expansion the entire time.

    The institution that converted land into knowledge

    In 1862 — the same year as the Homestead Act — Congress passed the Morrill Act. Where the Homestead Act converted public land into private farms, the Morrill Act converted public land into public universities. Each state received federal land — eventually 17.4 million acres in total — to fund colleges that would teach agriculture, engineering, and the mechanical arts to the working population. Not the elite. The farmer. The mechanic. The person who needed applied science, not classical letters.

    The land grant universities that followed — Michigan State, Cornell, Texas A&M, the University of California, Iowa State, and sixty-five others — were the most successful knowledge commons in American history. They produced the agricultural science that made the Corn Belt productive, the engineering that built the infrastructure, the hard science that eventually became the foundation for everything that followed. The Hatch Act of 1887 created agricultural experiment stations at every land grant institution. The Smith-Lever Act of 1914 created the Cooperative Extension Service — the county agents who drove out to the farm, read the soil test, watched the aquifer level, and tracked the patterns that compound over decades into catastrophe or productivity. It was not only a knowledge transfer system. It was a monitoring infrastructure — a distributed network of observers whose institutional job was to watch what was happening to the shared resources that no individual farmer could see alone.

    The commons the Morrill Act built with land kept expanding through the next century through public investment that never stopped: the GI Bill sent eight million veterans through higher education on the public’s account. Economists still identify it as the highest documented return on any federal investment in American history. An educated population as public good, not private transaction.

    What the knowledge commons produced

    The land grant college was the seed. What grew from it was not only agricultural science.

    The Defense Advanced Research Projects Agency — DARPA — funded the network that became the internet beginning in 1969. The protocols that make it work, TCP/IP, were developed at Stanford under DARPA contract. The National Science Foundation funded the backbone infrastructure through the early 1990s. When the network was privatized in 1995, the protocols, the architecture, and the network effects built on fifty years of public investment transferred to private hands without a royalty collected on the public’s behalf. The private sector did not build the internet. It inherited it. The government that should have collected a return on that inheritance on behalf of the public that funded it did not. The mechanism to do so was never built.

    The Global Positioning System was built by the Department of Defense at an initial cost of approximately $12 billion. It was a military navigation tool opened to civilian use in 2000. RTI International estimates GPS generated $1.4 trillion in economic value in the United States between 1984 and 2017 alone — with ninety percent of that value accruing after smartphones made it a mass consumer technology. The industries built on GPS generate hundreds of billions in annual revenue. The government collects no royalty on that foundation on the public’s behalf. The constellation was a public investment. The return was entirely private.

    The federal government has invested more than $900 billion cumulatively in the National Institutes of Health since 1938. That investment produced the foundational science underlying virtually every major pharmaceutical compound on the market. The Bayh-Dole Act of 1980 gave universities and private companies the right to patent those discoveries and charge what the market would bear. The public paid for the basic research. It paid again at the pharmacy. Built into Bayh-Dole were march-in rights — the explicit statutory authority for the federal government to license a federally funded patent to competing manufacturers when the patent holder is not making the invention available on reasonable terms. March-in rights have never been exercised once in forty-five years. Not for insulin, rationed by Americans at $300 to $400 per vial for a drug that costs $2 to $6 to manufacture, whose patent was sold to the University of Toronto in 1921 for one dollar so it would be available to everyone who needed it. The royalty mechanism existed. It was built into the law. It has never been used.

    The commons expanded into intelligence itself

    The AI industry’s current valuation is measured in trillions. It was built on a foundation assembled with public money over fifty years — the DARPA-funded research, the public university laboratories, the publicly funded internet infrastructure, and the accumulated written output of human civilization scraped, ingested, and productized without payment to the people who produced it.

    Common Crawl, the nonprofit that organized the public internet into training datasets used by every major AI model, received $250,000 each from Anthropic and OpenAI in 2023 — for datasets worth billions in commercial value. The Books3 dataset used to train multiple AI models contained over 196,000 books whose authors were never contacted, never paid, and in most cases never notified. OpenAI acknowledged to the House of Lords that it would be impossible to train today’s leading AI models without using copyrighted materials. The material was used regardless.

    The human genome is the same argument at the most fundamental scale. The Human Genome Project was publicly funded — a thirteen-year, $3 billion international collaboration completed in 2003 — and the sequence was deliberately placed in the public domain to prevent private patenting of the human genetic code. The downstream application of genomic knowledge — the diagnostic tools, the drug targets, the personalized medicine built on the public sequence — has flowed predominantly into private hands through the same Bayh-Dole mechanism that governs the rest of the NIH portfolio. The most universal inheritance in the history of biology — the genetic sequence shared by every human being — was built into a commons deliberately and has been converted into private commercial infrastructure in the decades since.

    The inversion of the original bargain

    The public funded the internet, the GPS constellation, the pharmaceutical knowledge base, and the AI training foundation. No royalty was collected on its behalf for any of it. The industries that inherited those foundations — and the trillions in annual revenue they generate — now fund the political apparatus that determines whether a royalty mechanism will ever be built. The people who paid for the foundation are taxed on their labor to fund the government that manages it, while the people who took the foundation shape the government’s decisions about what it is owed.

    The original bargain — the public owns the commons, the commons funds the government, the government serves the public — was inverted. What replaced it is the arrangement this series documents.

    What the through-line is

    Morrill Act. DARPA. GPS. NIH. The internet. The human genome. These are not technology stories or education stories or pharmaceutical stories. They are the same story as the land grant and the railroad grant and the Mining Law — the public commons, built through collective investment, transferred to private hands at terms the public never set, in rooms the public never entered, by people with a specific interest in the outcome.

    The commons kept expanding. The transfer logic kept pace with it. Block 10 documents the balance sheet. The mechanism blocks in between show how the room that managed the transfer was protected so the accounting would never arrive.

    Sources

    1. Morrill Act of 1862. Pub.L. 37-108. 17.4 million acres. https://www.congress.gov/bill/37th-congress/senate-bill/130 — National Archives Milestone Documents confirms 17,400,000 acres.

    2. Hatch Act of 1887. Pub.L. 49-541. https://www.congress.gov/bill/49th-congress/senate-bill/372

    3. Smith-Lever Act of 1914. Pub.L. 63-95. https://www.congress.gov/bill/63rd-congress/senate-bill/2884

    4. GI Bill (Servicemen’s Readjustment Act of 1944). Pub.L. 78-346. 8 million veterans. https://www.congress.gov/bill/78th-congress/senate-bill/1767

    5. DARPA / ARPANET 1969. DARPA official history. https://www.darpa.mil/about/history/darpa-and-the-internet

    6. Internet privatization 1995. NSF backbone transfer history. https://www.nsf.gov/news/news_summ.jsp?cntn_id=103050

    7. GPS — $12 billion initial cost, $1.4 trillion economic value 1984–2017. RTI International, 2019. https://www.rti.org/publication/economic-benefits-global-positioning-system-gps/fulltext.pdf

    8. NIH cumulative investment $900 billion+. NIH Office of Budget. https://officeofbudget.od.nih.gov/approp_hist.html

    9. Bayh-Dole Act. Pub.L. 96-517 (1980). 35 U.S.C. § 203 (march-in rights). https://www.congress.gov/bill/96th-congress/senate-bill/414 — March-in rights never exercised: GAO-09-742. https://www.gao.gov/products/gao-09-742

    10. Insulin — $300–$400/vial, $2–$6 manufacturing cost. University of Toronto patent sale 1921: historical record.

    11. Common Crawl $250,000 donations from Anthropic and OpenAI 2023. ⚠ Primary source required — verify against primary reporting.

    12. Books3 dataset — 196,000 books. ⚠ Primary source required — verify against primary reporting.

    13. OpenAI House of Lords testimony on copyrighted materials. House of Lords Communications and Digital Committee, 2023. https://committees.parliament.uk/work/6986/large-language-models/publications/

    14. Human Genome Project — $3 billion, 13 years, completed 2003, public domain release. National Human Genome Research Institute. https://www.genome.gov/human-genome-project

    Block 1, Article 3. © 2026 Steve Sagnotti.

  • What the Settlers Didn’t See

    What the Settlers Didn’t See

    Block 1, Article 2

    © 2026 Steve Sagnotti.

    The settlers who arrived at the continent documented in Article 1 brought a frame with them. The frame said: wilderness. Unclaimed. Available. A land without owners waiting for people who would put it to use.

    The frame was wrong in a specific and consequential way. What the settlers encountered was not wilderness. It was the output of management systems that had been running for thousands of years — and misreading it as wilderness was the precondition for treating it as available.

    What the frame excluded

    The salmon runs that Lewis and Clark described as uncountable did not maintain themselves by accident. The Columbia River tribes — Nez Perce, Yakama, Umatilla, Warm Springs — had governance systems built around the river’s productive limits. First salmon ceremonies functioned as harvest controls: the first fish of the season were treated as sacred, returned to the river whole, a ritual acknowledgment that the run had to come back before it could be taken. Fishing rights were allocated by position on the river, inherited and governed by tradition. Waste was taboo. The archaeological record at Columbia River fishing sites shows continuous occupation across thousands of years, with salmon remaining the dietary foundation throughout. The runs lasted not because the river was inexhaustible but because the people who depended on it understood it was not.

    The eastern forests told the same story through a different mechanism. The park-like understory that early European settlers described — open ground beneath a high canopy, easy to walk through, almost landscaped in appearance — was not natural forest succession. It was the product of deliberate, systematic burning by indigenous peoples across centuries. Fire management removed undergrowth, encouraged the browse that supported deer and turkey, and reduced the risk of catastrophic wildfire. The settlers who described the eastern forest as a beautiful parkland were describing a tended landscape and calling it wilderness.

    The plains ecology was more complicated. Buffalo jumps — cliff-drive sites used across the Plains and Rockies, some for thousands of years — drove entire herds over edges, taking far more animals than could be immediately processed. The bone deposits at sites like the Vore Buffalo Jump near Sundance, Wyoming, represent tens of thousands of animals taken over centuries. The plains abundance held not because the bison were actively managed toward sustainability but because the constraints on the take were natural ones: population density was low, the technology was limited to foot pursuit and the occasional cliff, and the herds were large enough that the take, however intensive at any single site, did not outrun regeneration across the whole. The horse changed that. Arriving on the Plains from Spanish colonial stock in the late 1600s and early 1700s, it transformed bison hunting from a labor-intensive communal operation into something far more efficient — and the take accelerated visibly before any European hunter arrived. The constraint was the technology, not the intention.

    What the settler frame called wilderness was, in the river valleys and the eastern forests, the output of active management. On the plains it was the output of natural constraint. In both cases the frame’s claim — unclaimed, unmanaged, available — was wrong. And in both cases, what the frame excluded was the question of what would happen when the constraints were removed.

    The labor gap

    The abundance created an immediate problem the frame had no answer for: the continent was larger than the population available to work it.

    The settler population arriving in the 17th and 18th centuries was small relative to the scale of what was available to be claimed, cleared, planted, and harvested. Free labor was scarce and expensive in a land where land was cheap and available — the economic logic of coercion runs directly from that arithmetic. Indentured servitude was the first answer. Slavery was the second, and the more durable one: the forced importation of labor at scale to work a cornucopia that the available free population could not have exploited alone. The abundance did not cause slavery. But it created the economic conditions that made the institution seem, to those who built it, worth building.

    The epidemic context sits beneath all of this. The population the settlers encountered was not the population that had built and maintained the landscape they were entering. Disease moving through existing trade networks had preceded European settlement by decades in many regions — smallpox, measles, influenza reaching populations with no acquired immunity long before European settlers arrived in numbers. Cahokia, the city near present-day St. Louis that at its peak around 1100 AD was larger than contemporary London, was already centuries abandoned. The Ohio mound builders’ civilization, the dense agricultural settlements, the large towns — these had already contracted dramatically. The settlers read the aftermath of that collapse as the natural state of the continent. It was not. It was a specific, recent, catastrophic consequence of contact that the frame they brought with them had no way to account for.

    The first frame

    The settler frame — wilderness, unclaimed, available — was not cynical. It was, in the conditions it encountered, a plausible reading of what was visible. The population was sparse. The land appeared unimproved by European standards — no enclosures, no title deeds, no permanent agricultural infrastructure recognizable as such. The management systems that had produced the abundance were invisible to eyes that didn’t know what they were looking at.

    But the consequences of the frame were not dependent on its sincerity. The frame excluded the management systems. It excluded the civilizations that had contracted but not disappeared. It excluded the question of what the land would do once the constraints that had governed its use for thousands of years were removed. And it excluded — most consequentially — any obligation to the people who had been running those systems and were still there.

    The extraction logic that followed was not inevitable. It was chosen — by the legal instruments Article 4 documents, in rooms that had already decided which questions were permitted. The settler frame was not the cause of what followed. It was the precondition. It made the taking look like discovery.

    The abundance was real. The management that sustained it was real. The frame that called it wilderness was the first broken frame in the series. Everything downstream of it is the story of how that frame was written into law and protected for two and a half centuries.

    Sources

    1. Columbia River tribal salmon governance — first salmon ceremonies, allocation systems. Columbia River Inter-Tribal Fish Commission (CRITFC). https://www.critfc.org/salmon-culture/tribal-salmon-culture/

    2. Eastern forest fire management / park-like understory. William Cronon, Changes in the Land (1983). Hill and Wang. WorldCat: https://search.worldcat.org/title/51886348 — Omer Stewart, Forgotten Fires (2002). University of Oklahoma Press. WorldCat: https://search.worldcat.org/title/48966599

    3. Vore Buffalo Jump — bone deposits, centuries of use. Vore Buffalo Jump Foundation. https://www.vorebuffalojump.org

    4. Horse arriving Plains — late 1600s / early 1700s. Pekka Hämäläinen, The Comanche Empire (2008). Yale University Press. WorldCat: https://search.worldcat.org/title/604039789 — Dan Flores, American Serengeti (2016). University Press of Kansas.

    5. Slavery as labor answer to abundance arithmetic. Edmund Morgan, American Slavery, American Freedom (1975). Norton. WorldCat: https://search.worldcat.org/title/58800743

    6. Cahokia — peak population larger than contemporary London, circa 1100 AD. Timothy Pauketat, Cahokia (2009). Penguin. Cahokia Mounds State Historic Site: cahokiamounds.org. Archaeological consensus: population 10,000–20,000 at peak; London same period ~10,000–18,000.

    7. Pre-contact epidemic waves. Charles Mann, 1491 (2005). Knopf. Alfred Crosby, The Columbian Exchange (1972). Greenwood.

    Block 1, Article 2. © 2026 Steve Sagnotti.

  • What the Country Inherited

    What the Country Inherited

    Block 1, Article 1

    © 2026 Steve Sagnotti.

    The American continent was not a wilderness waiting to be discovered. It was a foundation waiting to be spent.

    Four hundred million beavers had spent thousands of years engineering the wetland systems of North America into one of the most productive landscapes on earth. Beavers build dams. Dams slow water. Slow water spreads across floodplains, settles into the ground, and stays. The dark topsoil of the Corn Belt — the soil that still feeds a significant fraction of the world — is largely what all that slowed water produced over millennia. The commons was not only the thing itself. It was the system that made everything else possible.

    What was here

    The bison numbered between 30 and 60 million on the Great Plains — a biomass so large it shaped the ecology of an entire continent. The herds cropped the grasses, their hooves aerated the soil, their movement across the plains drove the nutrient cycling that kept the grasslands productive. The western grasslands supported the grazers that supported the predators that supported the entire plains ecology — a self-regulating system running on solar energy and rain that had operated for thousands of years before a European eye fell on it.

    The Atlantic fisheries were so thick with cod that early explorers reported they could be scooped from the water in baskets. John Cabot’s crew in 1497 described lowering weighted baskets over the side of the ship and pulling them up full. The Grand Banks off Newfoundland held what was, for three centuries, the most productive fishery on earth. Closer to shore, the oyster reefs of Chesapeake Bay filtered the entire volume of the Bay every three to four days. The river systems of the Pacific coast held salmon runs so dense that Lewis and Clark, crossing the Rockies in 1805, described the Columbia as leaping with fish — a run so large it could be heard before it could be seen.

    Before European settlement, a billion acres of forest covered what is now the United States. The eastern seaboard was dense hardwood — chestnut, oak, maple — a canopy so continuous that legend held a squirrel could travel from the Atlantic to the Mississippi without touching the ground. The Great Lakes held white pine at a scale the logging industry arriving in the 1840s would call inexhaustible. The Pacific Northwest held Douglas fir and Sitka spruce at dimensions the eastern loggers had never encountered. The southern longleaf pine ecosystem ran from Virginia to Texas — 90 million acres of a single forest type, an ecological community that had shaped the culture, the economy, and the hydrology of the American South for millennia.

    Below the surface of all of it, a layer that made the agriculture possible. The A-horizon — the dark, carbon-rich topsoil — took thousands of years to form from the chemistry of decomposition, root systems, and the slow biological work of the grassland and forest ecosystems above it. When the Corn Belt was broken for agriculture in the mid-19th century, it was spending accumulated biological capital, not generating new wealth. Beneath eight Great Plains states, the Ogallala Aquifer held fossil water accumulated from Pleistocene glacial melt over six million years — the largest groundwater deposit in North America, the underground reservoir that would eventually make the semi-arid plains bloom.

    The forests. The fisheries. The grasslands. The topsoil. The aquifer. These were not resources waiting to be created. They were inheritance — the accumulated output of geological time, biological process, and ecological systems operating at scales the human economy had not yet learned to measure or to miss.

    The scale of the before

    640 million acres of public land. A billion acres of forest. Six million years of groundwater. Salmon runs so dense they could be heard. Cod dense enough to fill a basket. Bison in numbers large enough to darken the horizon for days as a herd passed.

    This is not a romantic inventory. These are the documented figures — the baseline against which everything the mechanism blocks document is measured. Block 10 closes the accounting. The distance between the before described in this article and the after documented there is the series argument made visible.

    The abundance this article inventories had one property that made everything else possible and everything else dangerous: it looked inexhaustible. The continent was large enough, the resources dense enough, the regeneration rates — in the centuries before the technology arrived to outrun them — fast enough that the assumption of endless supply was not obviously wrong. The cod had been there since before anyone could remember. The bison had numbered in the tens of millions across recorded history. The aquifer had never run dry.

    The assumption held until the technology arrived that could take faster than the commons could replenish. Then it didn’t hold at all. The Great Lakes white pine — inexhaustible in 1840 — was effectively gone by 1900. The Atlantic cod sustained a civilization for four centuries and collapsed to one percent of its historic biomass in a single generation once industrial trawling reached it. The Ogallala is being drawn down at rates that dwarf its natural recharge, on a timeline measured in decades in the most stressed regions.

    The abundance was real. The assumption of inexhaustibility was not. What changed between the two was the technology — and what the technology revealed was that the commons had always had a ceiling. The country just hadn’t found it yet.

    Sources

    1. Pre-contact beaver population 400 million. Naiman, R.J., Johnston, C.A., & Kelley, J.C. (1988). “Alteration of North American streams by beaver.” BioScience 38(11): 753–762. WorldCat: https://search.worldcat.org/title/1231932251 — Secondary: Beavers: Wetlands & Wildlife: https://www.beaversww.org/2019/05/08/wetland-engineer/

    2. Bison 30–60 million. Dan Flores, American Serengeti (2016). University Press of Kansas.

    3. Cabot 1497 / cod in baskets. Mark Kurlansky, Cod (1997). Walker & Company. WorldCat: https://search.worldcat.org/title/1368216880

    4. Grand Banks productivity. NOAA Fisheries. https://www.fisheries.noaa.gov/feature-story/history-and-science-grand-banks

    5. Chesapeake Bay oyster filtration 3–4 days. Chesapeake Bay Foundation. https://www.cbf.org/about-the-bay/more-than-a-magazine/chesapeake-quarterly/a-keystone-species-recovering-oysters-and-the-chesapeake-bay/

    6. Lewis and Clark Columbia River salmon. Journals of Lewis and Clark, 1805. Library of Congress. https://www.loc.gov/collections/lewis-and-clark-journals/

    7. Forest cover 1 billion acres pre-settlement. USGS / Newsweek, March 2025. https://www.newsweek.com/map-reveals-how-americas-forests-have-changed-over-time-2052339

    8. Southern longleaf pine 90 million acres. Longleaf Alliance. https://www.longleafalliance.org/what-is-longleaf

    9. A-horizon / topsoil formation. USDA NRCS. https://www.nrcs.usda.gov/conservation-basics/natural-resource-concerns/soils/soil-health

    10. Ogallala Aquifer — six million years / fossil water. USGS Circular 1182. https://pubs.usgs.gov/circ/1182/

    11. 640 million federal acres. BLM. https://www.blm.gov/about/what-we-do/desert

    12. Great Lakes white pine collapse 1840–1900. USFS history. https://www.fs.usda.gov/inside-fs/delivering-mission/excel/history-forests-national-forests

    13. Atlantic cod collapse to 1% of historic biomass. DFO Canada. https://www.dfo-mpo.gc.ca/fisheries-peches/ifmp-gpmp/groundfish-poissons-demersaux/cod-morue2019-eng.htm

    14. Ogallala depletion rates vs. recharge. USGS groundwater monitoring. https://www.usgs.gov/mission-areas/water-resources/science/groundwater-depletion

    Block 1, Article 1. © 2026 Steve Sagnotti.