Block 3, Article 1 — One Person, One Vote Made It Worse
© 2026 Steve Sagnotti.
How are the lines around your district drawn — and by whom?
Before 1964, the map was already broken — just broken differently.
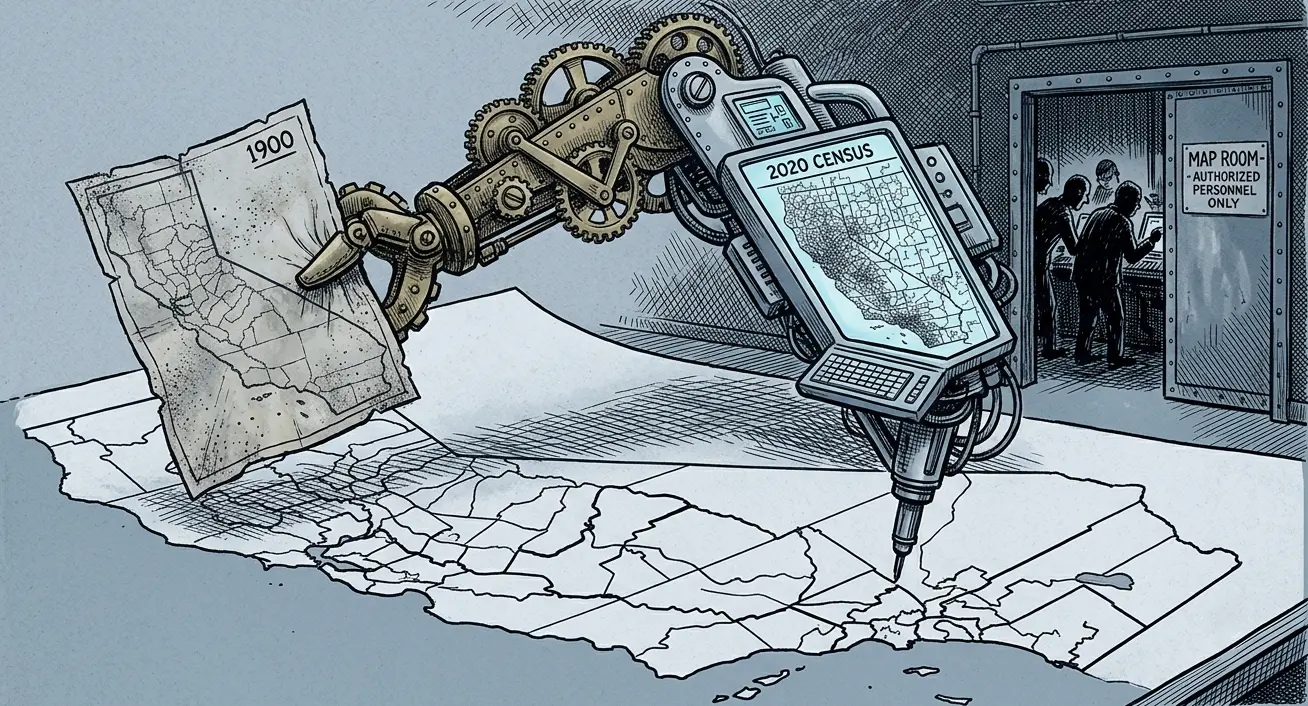
State legislatures drew district lines and then didn’t redraw them. For decades. Alabama ran on its 1900 census districts until 1964. Rural counties with a few thousand voters sent the same number of representatives to the state legislature as urban counties with hundreds of thousands. A vote cast in the country outweighed a vote cast in the city by a factor of ten or twenty or more, depending on the state. The distortion wasn’t hidden — it was the point. Rural legislative majorities protected rural legislative majorities by refusing to redraw the maps that produced them.
The cities were growing. The maps didn’t change. The room was already a fiction.
The reform that handed over the instrument
The Warren Court fixed it. Reynolds v. Sims (1964) established the principle in a phrase that still sounds self-evident: legislators represent people, not trees or acres. Equal-population districts, required after every census. The rural bloc that had ignored the urban majority for generations lost its legal anchor. Malapportionment was over.
Justice John Marshall Harlan II dissented. He predicted what would follow: states that couldn’t draw lines by geography would gerrymander by party instead, producing the same distortion through a different door. He was right — though even he likely didn’t anticipate how right.
Equal-population districts didn’t constrain the gerrymander. They enabled a more precise version of it.
Here is what Reynolds actually did: it set a mathematical requirement — every district must contain approximately the same number of people — and then left everything else to the states. Which people go in which district remained entirely up to whoever drew the map. And when every district must contain the same number of people, the only remaining variable is which people. Pack your opponent’s voters into as few districts as possible. Crack the remainder into thin minorities spread across adjacent districts. The constraint wasn’t a check on manipulation. It was a specification for it.
Reynolds handed mapmakers a precision requirement. It did not give the public any say in how that precision was used.
Reynolds didn’t strip away a compactness requirement — a rule that a district has to be a reasonably regular shape, not one gerrymandered to grab specific voters — because there wasn’t one left to strip. Congress had already dropped federal compactness and contiguity standards — the requirement that a district be one connected shape, not several separate pieces stitched together — in 1929, the same legislative moment The Frozen Room documents freezing the House at 435 seats — one repeal that left the chamber unable to grow, the other that left the map under no obligation to make sense.
The Reynolds decision was framed as the guarantee of equal representation. The optimization it enabled was never part of that frame.
The instrument gets built
For twenty years after Reynolds, the gerrymander was still a manual operation. A consultant working with paper maps, census tables, and pencil calculations could produce a distorted district — Elbridge Gerry had managed that in 1812 with a salamander-shaped district in Massachusetts — but the distortion had friction. A human draftsman could only draw and compare so many maps in a single redistricting cycle. You could engineer a district. You couldn’t engineer a state.
The friction disappeared in stages.
During the 1980s, redistricting moved from paper to computerized databases. Demographic data, voter registration records, past electoral results — all of it digitized, all of it sortable. By the 1990s, Geographic Information Systems software — GIS — running on desktop computers could layer all of that information over census geography and reconfigure it in real time. Racial composition, income levels, party registration, precinct-level vote history: visible, sortable, mappable at the city-block level.
The software that became the industry standard was called Maptitude for Redistricting, built by Caliper Corporation. It turned what had been a drafting problem into an optimization problem. A redistricting consultant could now generate thousands of legally compliant maps — every one meeting the Reynolds equal-population standard — and select the most advantageous one from the pool.
The precision Reynolds required, GIS delivered. The reform and the instrument arrived together.
The room where it happened
By the time the 2010 redistricting cycle arrived, the setup was complete. Thirty years of GIS development had produced software capable of engineering a map at the census-block level — the smallest unit of population data the federal government produces, sometimes fewer than a hundred people. Reynolds had made equal population the floor. Maptitude had made everything above the floor available for manipulation.
The people who used it knew exactly what they were doing. In 2011, Republican redistricting operatives in Wisconsin barricaded themselves in a law firm — they called it the Map Room — with Maptitude running on their laptops and non-disclosure agreements signed before anyone walked in. Legislators were brought in one at a time to see their new districts. They were not allowed to take the maps with them when they left.
That is not politics as usual. That is a precision instrument operated in secret. The variable being optimized was never just which party wins. It was which specific incumbents would sit on which specific committees — Natural Resources, Agriculture, Energy and Commerce, the Interior appropriations subcommittee — and what those committees would do with a decade of uncontested control.
Reynolds v. Sims established that your vote has to count equally. It did not establish that the lines around your district have to be drawn fairly. That gap — between the principle and the enforcement — is where the precision instrument lives.
The next article shows what happened when someone picked it up at industrial scale.
Your district has a score. Most people have never seen it.
| Your district’s partisan fairness grade, efficiency gap score, and competitiveness rating | https://gerrymander.princeton.edu |
| An interactive map showing the demographic and partisan composition of your district, with tools to draw alternatives | https://davesredistricting.org |
Sources
1. Reynolds v. Sims, 377 U.S. 533 (1964). https://supreme.justia.com/cases/federal/us/377/533/
2. Wesberry v. Sanders, 376 U.S. 1 (1964). https://supreme.justia.com/cases/federal/us/376/1/
3. Justice Harlan dissent. Reynolds v. Sims at 589–625. https://supreme.justia.com/cases/federal/us/377/533/
4. Alabama 1900 districts in use until 1964. Baker v. Carr, 369 U.S. 186 (1962). https://supreme.justia.com/cases/federal/us/369/186/
5. Maptitude for Redistricting. Caliper Corporation. https://www.caliper.com/maptitude-for-redistricting/
6. GIS adoption in redistricting 1980s–1990s. David Daley, Ratf**ked (2016). Liveright. Chapter 3. WorldCat: https://search.worldcat.org/title/923794434
7. Wisconsin Map Room / NDA. David Daley, Ratf**ked (2016). Chapter 4.
8. Gerrymandering origin — Elbridge Gerry 1812 Massachusetts. Boston Gazette, March 26, 1812. Library of Congress. https://www.loc.gov/resource/sn83045240/1812-03-26/
Block 3, Article 1. © 2026 Steve Sagnotti.
Leave a Reply