Block 10, Article 2 — The Dust Bowl Got a New Deal. The Invisible Dust Bowl Gets a Farm Bill.
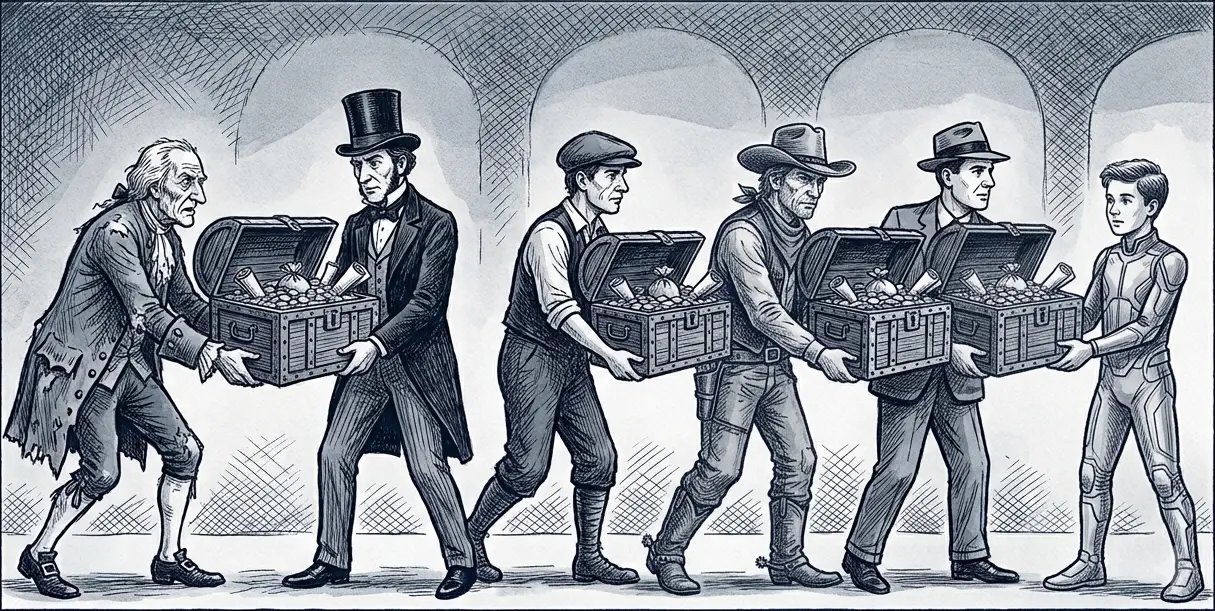
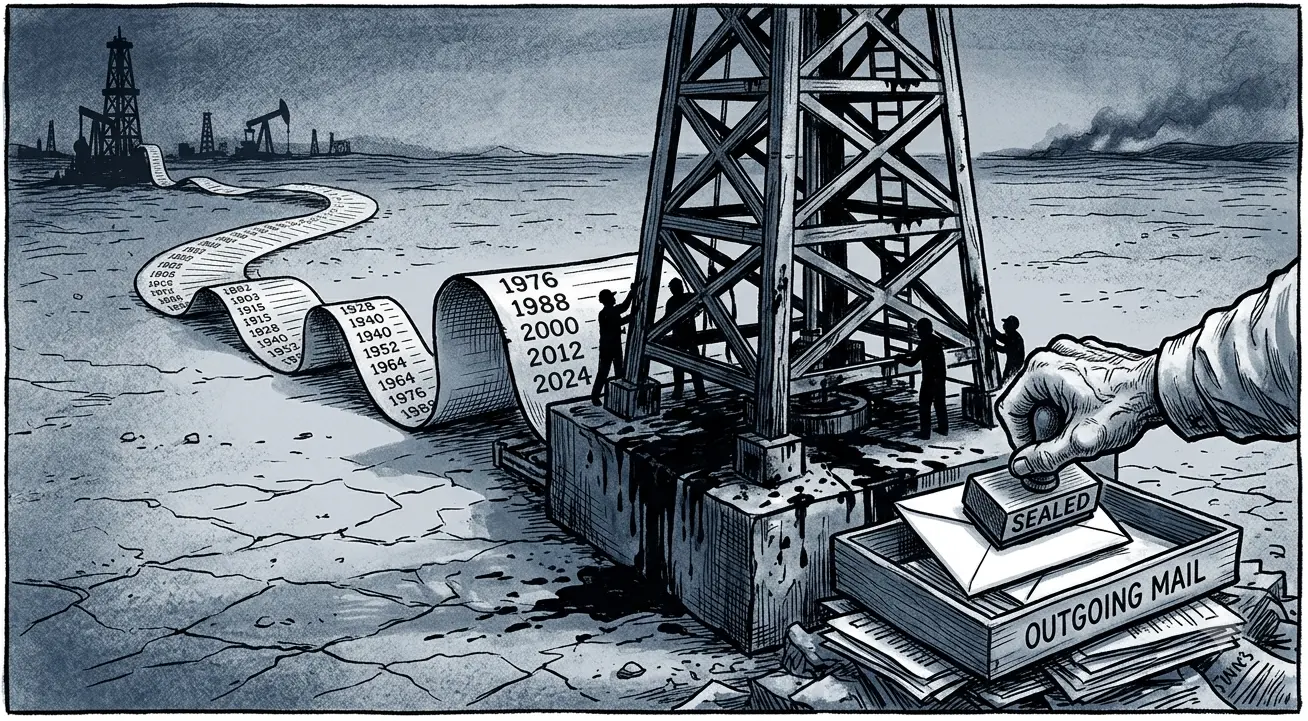
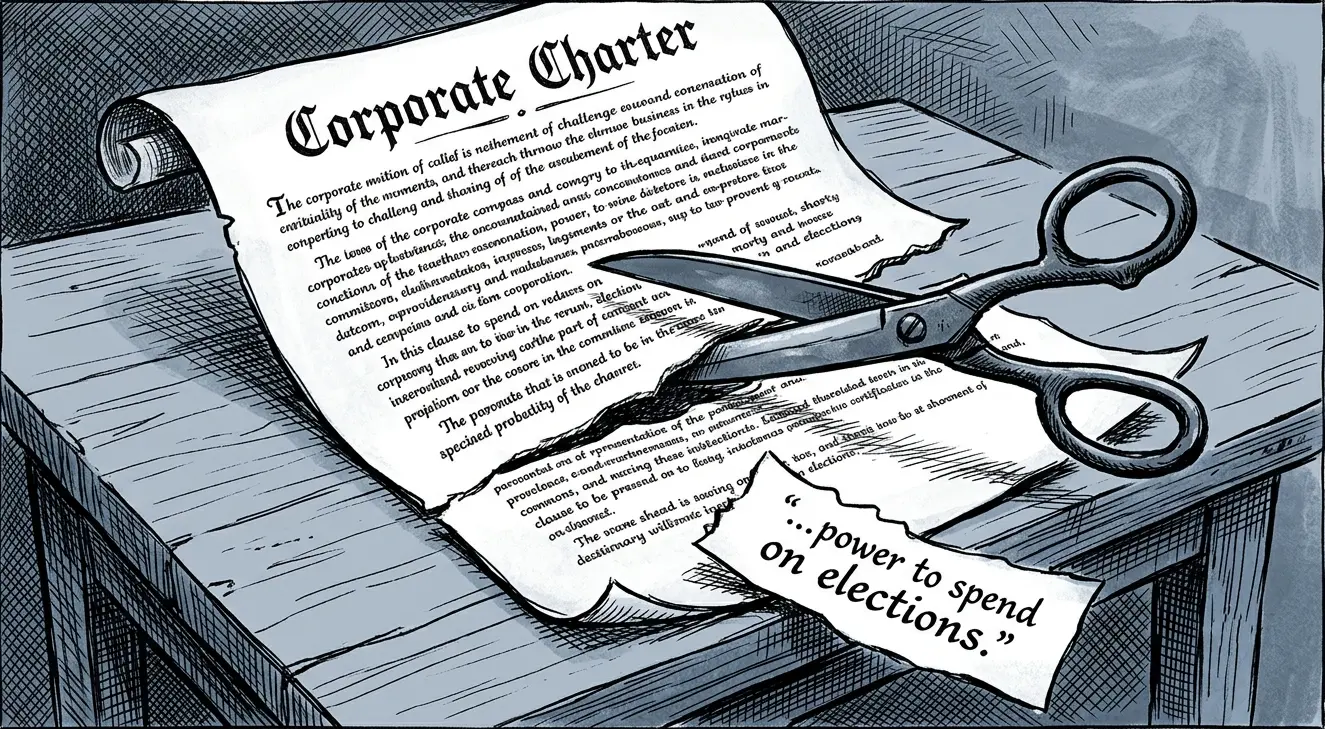
The legal architecture that arranged the transfer also arranged for the accounting not to happen.
American farmland looks different from a plane than it did a generation ago.
The hilltops are lighter. Where the topsoil ran deep, the color was almost black. Where it has gone, the subsoil shows through — tan, gray, the color of something used up. You can see it in satellite imagery. The USDA has the data. The crisis is documented in peer-reviewed journals, federal databases, and agricultural extension reports. It is happening in full view of every instrument we have built to detect it. What it is not doing is blowing through Washington.
This article is the ground entry in the balance sheet. The soil. The forests. The food commons. Three categories, one logic: the extraction ran at rates that exceeded replenishment, the costs were deferred to people who had no vote on the decision, and the room that should have done the accounting was occupied by the people who benefited from not doing it.
The three ways to lose the ground
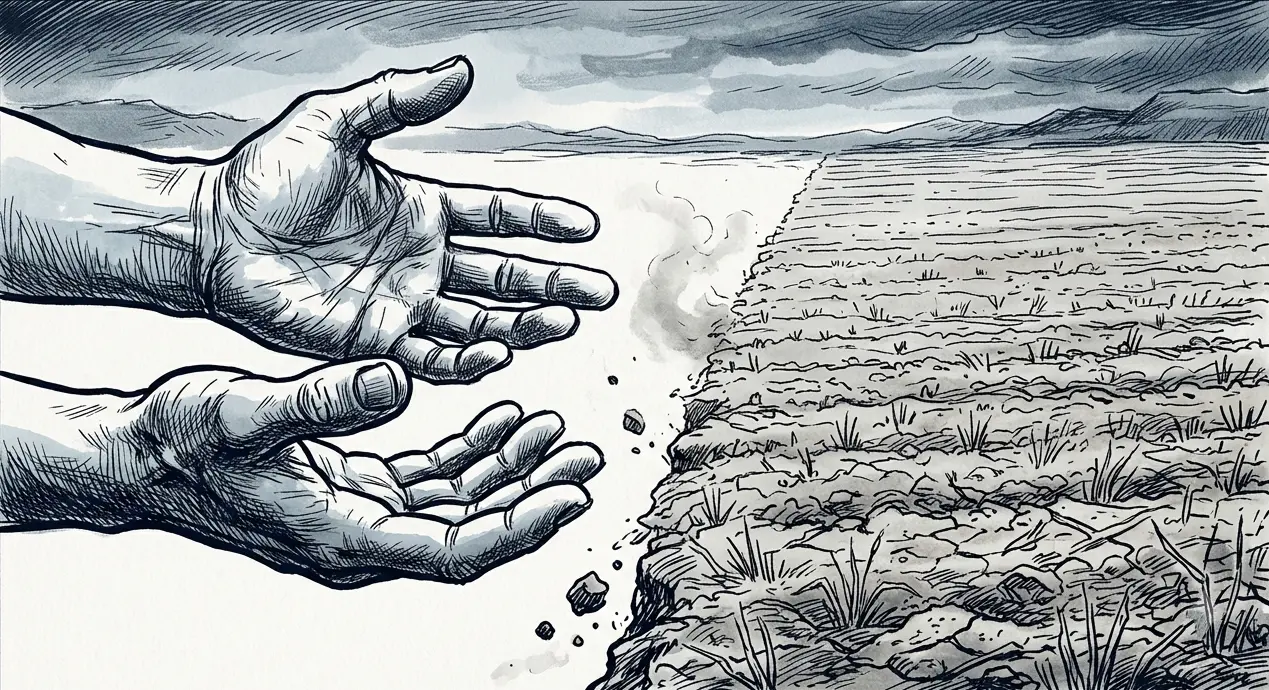
The topsoil. The A-horizon — the dark, carbon-rich layer that makes agricultural land productive — took thousands of years to form. One inch of it takes several hundred to a thousand years to build. It is being removed by tillage and erosion at rates that dwarf natural replenishment. A 2021 PNAS study using satellite and LiDAR data found that 35 percent of the cultivated area of the Corn Belt has completely lost its A-horizon. A 2022 University of Massachusetts study put the total topsoil loss across 160 years of Midwest farming at 57.6 billion metric tons — double the rate the USDA considers sustainable. Iowa cropland has lost an average of 6.8 inches since 1850. The current erosion rate runs 10 to 25 times faster than the rate at which topsoil forms. The losses are not recoverable on any agricultural planning horizon.
The water beneath it. The Ogallala Aquifer underlies 175,000 square miles across eight Great Plains states and supplies irrigation for crops worth more than $20 billion annually. The water is fossil water, accumulated over millennia from Pleistocene glacial melt. It recharges at roughly half an inch per year. It is being drawn down at one to three feet per year in Kansas and Texas. In the southern plains, communities that built their economies on irrigation are already drilling deeper and finding less. Scientific American’s estimate for refill time when the southern portions run dry: 6,000 years. That is not a recovery timeline. It is an epitaph.
The ground itself. When water is removed from clay and silt layers underground, those layers compact and the surface sinks — permanently. California’s San Joaquin Valley has sunk as much as 28 feet in some locations since the 1920s — what USGS researchers called the single largest human alteration of the Earth’s surface topography. Subsidence permanently reduces aquifer storage capacity. The ground can never hold as much water again even if extraction stops.
The crisis that doesn’t blow through Washington
The Dust Bowl was impossible to ignore. In May 1934, a single storm stripped an estimated 300 million tons of topsoil from the Great Plains and deposited it across the Eastern Seaboard. On Black Sunday, April 14, 1935, a wall of black dust 200 miles wide moved at 60 miles per hour from the Plains to the Atlantic. It settled on the desks of Congress. The crisis was visible to the people with the power to respond. They responded: the Soil Conservation Service, federal crop programs, the shelterbelt windbreak project, land retirement programs. The room acted because the room could see the problem.
The current erosion crisis is measurably worse and almost entirely invisible. According to the Union of Concerned Scientists, U.S. croplands today lose at least twice as much soil annually as the Great Plains lost at the peak of the Dust Bowl — every year, not just in the crisis decade. At current rates, farmers will lose more than eight times the total Dust Bowl soil loss by 2035. In 2025, dust storms in Kansas and the Texas Panhandle killed twelve people. The conditions are not entirely historical.
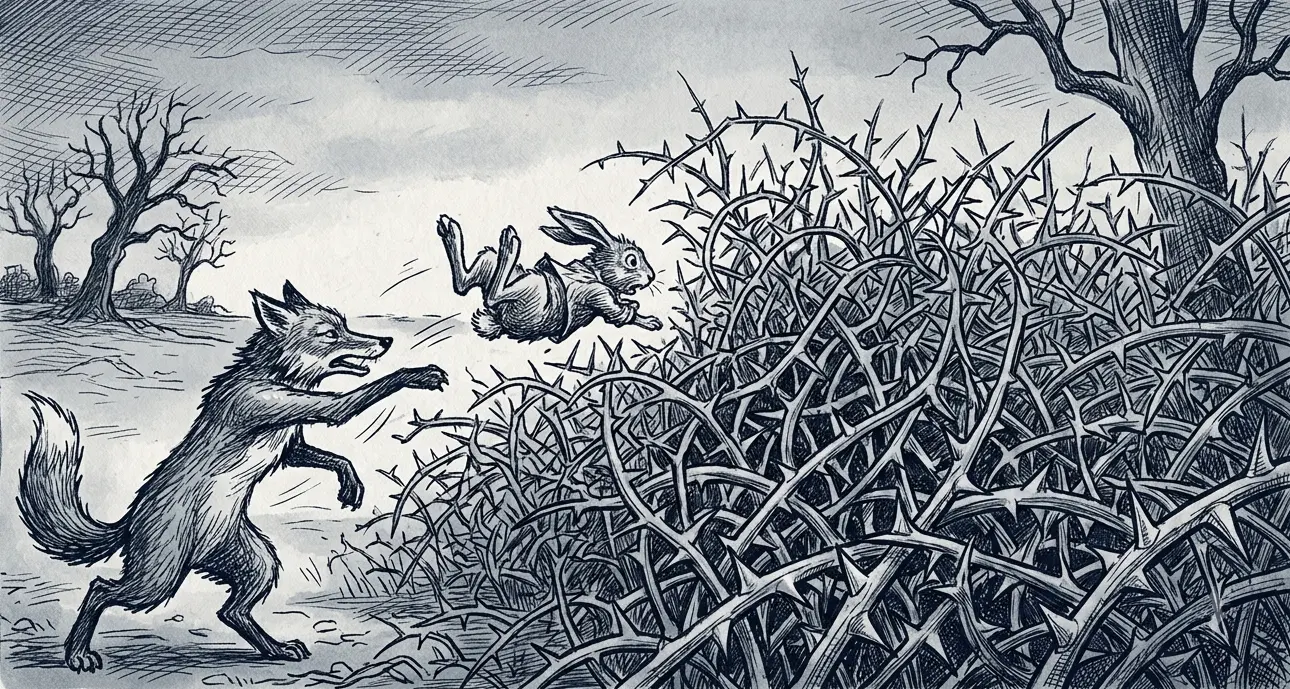
The difference is that the current crisis doesn’t blow through Washington. It is documented in satellite data, peer-reviewed journals, and federal agency reports. The room that responded in 1935 because it could see the damage has since eliminated its own scientific capacity — the Office of Technology Assessment closed in 1995, USDA research budgets have been systematically cut, and the agricultural lobby that benefits from current extraction practices funds the campaigns of the committee members who would authorize the response. The Dust Bowl got a New Deal. The invisible dust bowl gets a farm bill written by the people extracting from the land it is supposed to protect.
The current erosion crisis was framed, when it was discussed at all, as a technical soil-management question for individual farmers to address through their own practices. That it is measurably worse than the disaster that produced the Soil Conservation Service, and invisible to Washington only because the institutions that would have made it visible were defunded, was not in that frame.
The forests: what the cutting produced and what remained
Before European settlement, forests covered approximately one billion acres of what is now the United States. The industrial logging machine arrived after the Civil War. The Great Lakes forests — Michigan, Wisconsin, Minnesota — were first. Lumber companies purchased land, clearcut it to the horizon, built boom towns around the mills, and moved on when the timber ran out. The pattern repeated in the South, then in the Pacific Northwest. By 1920, U.S. forest cover had reached its lowest point in the country’s history. Of the roughly one billion acres of forest that existed at European contact, an estimated 90 to 95 percent of old-growth is gone from the lower 48 states. In New England, less than 1 percent of pre-colonial old growth survives.
What the public retained was what the private market couldn’t reach or didn’t want — land too steep, too remote, or already federal before the logging companies arrived. Then the government subsidized private extraction of that remainder too. The mechanism was road building. The Forest Service constructed and maintained the access roads into national forest timber sale areas at public expense. The timber contracts covered the trees. The infrastructure that made extraction possible — graded roads, bridges, log transfer facilities — was paid by the taxpayer and handed to the contractor as a precondition of the bid. The contract winner did not build the road. The public built the road so the contract winner could bid on the timber.
The economics that resulted were negative for the public before a single tree fell. A 1984 GAO study found that below-cost timber sales in four western regions produced shortfalls of $64 million in fiscal year 1981 and $92 million in 1982. The Tongass National Forest in Alaska runs the same arithmetic at a larger scale. The federal government spent $1.96 billion on Tongass logging over four decades and collected $227 million in revenue. Between 1999 and 2018 alone, the Forest Service lost $598 million in taxpayer money on Tongass timber sales — an average net loss of $30 million per year. The public subsidized the removal of its own trees at a net loss. The industry kept the timber. The public kept the logged watershed, the erosion, the collapsed salmon runs, and the fire risk.
The Tongass arrangement was not an accident or a miscalculation. The federal government created it deliberately. Two pulp mills were granted 50-year exclusive contracts in territorial days — with no competitive bidding — giving them exclusive access to hundreds of billions of board feet of public timber. The minimum price for Tongass timber could never go below 50 cents per thousand board feet. The Forest Service’s own cost to administer the sales ran $10 to $15 per thousand board feet. The contractor paid roughly 10 percent of what it cost the public to make the timber available. The Alaska congressional delegation, with the committee seniority to deliver appropriations, delivered them — for an industry that employed a few thousand workers, many of them nonresidents, for the duration of the contracts, and then left. The mills closed not because of environmental protection but because tree farms in South Africa, where forests grow faster, undercut them. In 2019, the Forest Service offered a Tongass timber sale and received zero bids after two attempts. The trees were gone. The roads remain.
This is not how comparable timber economies are structured. In British Columbia — which harvests similar forest types on similar Crown land — the licensee builds the roads, maintains them, and funds reforestation from proceeds. Stumpage rates are market-adjusted, recalculated against actual timber values. The proceeds fund education, health care, and First Nations revenue sharing. When the United States timber industry spent decades arguing that Canadian stumpage rates constituted an unfair subsidy — the basis of a long-running softwood lumber trade dispute — the implicit argument was that Canada was charging too little. During those same decades, the U.S. Forest Service was building roads to American timber sale areas at taxpayer expense and selling the timber at a net loss. The industry that complained about Canadian subsidies was the beneficiary of a larger one.
Norway requires forest owners to set aside a percentage of harvest proceeds into a mandatory fund reinvested in the forest — tree planting, road building, education. The harvester funds the infrastructure from their own proceeds. Finland manages state forests through a commercial enterprise that factors road costs into the timber price and sets harvest volumes below annual growth rates, so Finnish forest resources increase each year. The principle across all three jurisdictions is the same: the extractor bears the cost of extraction, the public collects a return that reflects what the resource is worth, and what remains after cutting is at least as productive as what was there before.
A 2025 executive order directed Interior and Agriculture to bypass Endangered Species Act protections to ramp up federal timber sales. The last of the protected old growth — trees that survived industrial cutting because the government stood between them and the market — is now under renewed extraction pressure. The road, as always, will be maintained at public expense.
The forest you own and cannot reach
The national forests of Oregon were built for logging. The roads were graded, the brush was cut, the culverts were maintained — because timber contracts required accessible terrain and the Forest Service budget followed the timber program. The timber is gone. The budget went with it. What remains is a road system designed for 60,000-pound log trucks, now maintained for neither log trucks nor the public that tries to use it for recreation. The roads are washing out. The brush is reclaiming the margins. The gates are going up — not because the forest is closed, but because the Forest Service no longer has the staff or budget to manage the site, and the alternative to a gate is liability. The Forest Service’s deferred road maintenance backlog now exceeds $3 billion nationally.
The sites that stay open increasingly belong to concessionaires: private companies collecting fees on campgrounds the public built, on roads the public maintains at a loss, in forests the public owns. The Metolius River in Oregon’s Deschutes National Forest illustrates what the system produces. On a Saturday morning in peak season, a survey of the campgrounds along the river found roughly 25 to 30 percent of sites paid and empty — reserved for the weekend, fees collected, nobody there. The remaining sites were occupied. Every campground on the river runs on the reservation system, with one or two first-come sites per campground as a nominal concession to spontaneous use. The concessionaire collected full payment on every reserved site whether or not the occupant arrived. The family that drove to the river that morning found no vacancy — not because the forest was full, but because the contractor’s booking system has no mechanism and no incentive to release paid no-show sites back to the public. The hotel discounts the empty room at midnight. The concessionaire on public land doesn’t have to. They already got paid.
The forest is public land. The contractor’s till is full. The site is empty. The family turned around.
What the supply chain removed
The Hood strawberry has a shelf life of roughly 24 hours after picking. It is so fragile it bruises in the hand. It is also, by the judgment of everyone who has eaten one, among the finest strawberries ever grown — intensely flavored, deeply red all the way through, sweet without being cloying. It exists almost nowhere in commercial distribution because it cannot survive what commercial distribution requires.
Strawberries for the mass market are picked at 80 to 90 percent maturity — firm enough to survive refrigerated transport from California or Chile, firm enough to look like a strawberry on the shelf for five days. The final stage of vine ripening is where the sugars and volatile aromatic compounds that create flavor develop. Picked before that window closes, the fruit continues to soften and redden in transit, arriving with the appearance of ripeness and a fraction of its flavor and nutritional content. The consumer sees a red strawberry. The strawberry was never allowed to become what a strawberry is.
The vintner harvests at peak ripeness, because the consumer can taste the difference and will pay for it. The commodity strawberry grower cannot — not because the grower doesn’t know the difference, but because the supply chain that connects field to consumer optimizes for durability, not flavor, and the consumer at the warehouse store has no alternative basis for comparison. The market structure made the choice before the consumer arrived. The Hood strawberry was bred out of commercial existence not because consumers rejected it. They never had the opportunity to choose.
USDA data comparing nutritional content of fruits and vegetables between 1950 and 1999 documents measurable declines across protein, calcium, iron, and vitamin C in commodity varieties — the result of breeding programs that selected for yield, uniformity, and transport durability over nutritional density. The scent was bred out of the commercial rose for the same reason: metabolically expensive, fades in transit, irrelevant to a purchase made by the dozen at a warehouse store. The optimization was rational within its own terms. What it optimized away was the point.
What is not in the price of the supermarket strawberry: the carbon cost of the 1,500-mile average journey from American farm to American plate. The aquifer depletion in California’s Central Valley — which grows a third of American vegetables and two-thirds of its fruits and nuts on ancient groundwater being drawn down faster than it recharges. The destruction of the American cut flower industry — tens of thousands of growers largely eliminated within two decades of trade agreements that made the Colombian import artificially cheaper, without pricing in the drainage of the Bogotá savanna wetlands that Colombian production required. The nutritional losses from fifty years of variety consolidation. None of these costs appear in the price. The market reads the resulting purchases as a revealed preference for the product that survives the supply chain. What it is reading is the outcome of optimization that externalized its costs onto the soil, the aquifer, the displaced grower, and the generation inheriting the balance sheet.
The Hood strawberry is not a romantic argument about simpler times. It is evidence. The flavor and the nutrition left together, by the same process, for the same reason. The commons food system — seasonal, regional, nutritionally dense — was not replaced by something better. It was replaced by something cheaper, in a price that did not include what it cost.
The topsoil entry in this ledger doesn’t close. Block 11 names it as one of three pillars that don’t come back on any timeline a functioning room could act on — the food production system this article documents is built on top of it.
Check this yourself: USDA NRCS National Resources Inventory, cropland erosion data
nrcs.usda.gov/resources/data-and-reports/national-resources-inventory
— — —
Steve Sagnotti
is a serious amateur photographer, writer, and technologist based in Oregon. With his camera he tries to capture common images not often seen, leading to common questions not often asked.
© 2026 Steve Sagnotti
— — —
Sources
A-horizon loss, Corn Belt (35%), Thaler et al., PNAS 118(8), 2021.
https://doi.org/10.1073/pnas.1922375118
Iowa topsoil loss (6.8 inches since 1850), Rick Cruse/Iowa State via Business Record.
https://www.businessrecord.com/cruse-iowa-has-lost-6-8-inches-of-topsoil-a-1-billion-a-year-economic-hit/
Ogallala/High Plains Aquifer overview (175,000 sq. mi.), USGS.
https://www.usgs.gov/mission-areas/water-resources/science/high-plains-aquifer
San Joaquin Valley subsidence (28 feet since 1920s), USGS Circular 1182.
https://pubs.usgs.gov/circ/circ1182/pdf/06SanJoaquinValley.pdf
Black Sunday, April 14, 1935 dust storm, National Weather Service.
https://www.weather.gov/oun/events-19350414
Union of Concerned Scientists, “Eroding the Future” report, current erosion rate vs. Dust Bowl peak.
https://www.ucs.org/resources/how-soil-erosion-threatens-food-and-farms
2025 Kansas dust storm deaths, Kansas Highway Patrol official statement (8 dead, I-70 Sherman County).
https://kansashighwaypatrol.gov/khp-2025-05-khp-investigating-multi-vehicle-collision-in-sherman-county/
2025 Texas Panhandle dust storm deaths (3 dead, Amarillo-area crashes, same storm system).
https://www.foxweather.com/weather-news/oklahoma-crash-kansas-texas-dust-storm
Tongass National Forest timber losses, 40-year figures ($1.96B spent, $227M revenue), Taxpayers for Common Sense.
https://www.taxpayer.net/energy-natural-resources/new-report-taxpayers-losing-hundreds-of-millions-of-dollars-on-tongass-timber-sales-over-last-two-decades-2/
Tongass 20-year subset ($598M / ~$30M average annual loss), Taxpayers for Common Sense.
https://www.taxpayer.net/energy-natural-resources/new-report-taxpayers-losing-hundreds-of-millions-of-dollars-on-tongass-timber-sales-over-last-two-decades/
1984 GAO below-cost timber sales study ($64M FY1981, $92M FY1982, four western regions).
https://gao.justia.com/department-of-agriculture/1984/6/congress-needs-better-information-on-forest-service-s-below-cost-timber-sales-rced-84-96
Executive Order 14225, “Immediate Expansion of American Timber Production,” signed March 1, 2025.
https://www.federalregister.gov/documents/2025/03/06/2025-03695/immediate-expansion-of-american-timber-production
Forest Service deferred maintenance backlog ($3B+), Taxpayers for Common Sense.
https://www.taxpayer.net/energy-natural-resources/new-report-taxpayers-losing-hundreds-of-millions-of-dollars-on-tongass-timber-sales-over-last-two-decades-2/
USDA 1950-1999 nutritional decline data, Davis, Epp & Riordan, Journal of the American College of Nutrition, 2004.
https://pubmed.ncbi.nlm.nih.gov/15637215/
American cut flower industry decline / Andean Trade Preference Act (Colombia), Washington Post.
https://www.washingtonpost.com/world/interactive/2025/valentines-flowers-imports-tariffs-colombia/