Block 6, Article 2
© 2026 Steve Sagnotti.
When did you last see a presidential candidate campaign in your state?
In the 2024 presidential election, approximately 97 percent of all campaign events and advertising spending were concentrated in seven states: Pennsylvania, Michigan, Wisconsin, Arizona, Georgia, Nevada, and North Carolina. California — the largest state in the union, 39 million residents — received zero general election campaign visits from either major presidential candidate. Texas received none. New York received none. Illinois received none. Florida received none.
The combined population of the states that received no presidential campaign attention exceeds the combined population of the states that received almost all of it. If you live outside those seven states, the presidential election was happening somewhere else. Your preferences, your concerns, your vote — none of it was being competed for. The math of the Electoral College made you irrelevant before the campaign started.
This is rational behavior, not negligence.
Why do campaigns ignore most of the country?
Under winner-take-all, a vote in a state you will carry by twenty points is worth nothing at the margin. A vote in a state you might win by one point is worth everything. Both campaigns execute this logic precisely. Resources flow to the states in play and nowhere else. California is Democratic by thirty points — no campaign event changes that. Texas is Republican by the same margin. The rational strategy is to ignore both and concentrate everything on the seven states where the outcome is uncertain.
The consequence is a presidential campaign conducted almost entirely in seven states, with policy promises calibrated to their specific economies. Candidates competing for Pennsylvania steelworkers make promises about trade. Candidates competing for Nevada casino workers make promises about labor law. Candidates competing for Wisconsin dairy farmers make promises about agricultural policy. An agricultural crisis in a safe state does not generate presidential attention. An industrial disruption in a swing state does.
The policy agenda of the presidency is shaped not by the scale of national need but by the electoral geography of the states in play. The president who appoints the Interior Secretary, signs mineral royalty legislation, and sets EPA enforcement budgets is chosen by a mechanism that concentrated 97 percent of 2024 campaign attention on seven states — none of which are the largest holders of federal commons.
The swing-state campaign was framed as rational strategy. What the frame excluded was the voter it made irrelevant — and the Interior Secretary they had no part in choosing.
The five inversions
The swing-state distortion is the present-tense consequence of the system the previous article documented. The five inversions are the historical record of the same mechanism producing its most extreme outcome: a president who lost the national popular vote.
The Electoral College has done this five times.
The first was 1824. Andrew Jackson won the popular vote and the most electoral votes but fell short of a majority in a four-candidate race. The House selected John Quincy Adams. Jackson won the popular vote by more votes than Adams received. It didn’t matter.
The second was 1876. Samuel Tilden won the popular vote by more than 250,000 votes. He appeared to have won 184 electoral votes — one short of a majority — when a congressionally appointed commission awarded twenty disputed electoral votes from three Southern states to Rutherford Hayes. The price was named explicitly in the negotiations: the end of Reconstruction. Federal troops withdrew from the South. The brief period of Black political representation that had followed the Civil War was closed. The Electoral College didn’t just produce the wrong winner. It traded the presidency for the dismantling of a constitutional experiment in racial equality.
The 1876 commission was framed as a constitutional crisis resolved. What the frame excluded was the voter whose representation was the price — and who paid it for the next ninety years.
The third was 1888. Grover Cleveland won the popular vote by 90,000 votes. Benjamin Harrison won the Electoral College. No dramatic backstory — the math simply inverted the will of the voters.
The fourth was 2000. Al Gore won the popular vote by 540,000 votes. The Florida recount — which the Supreme Court stopped in Bush v. Gore — determined 25 electoral votes. George W. Bush won the Electoral College 271 to 266. The Court that stopped the recount had, one year earlier, declined to rule on partisan gerrymandering. The same institutional architecture that rigged the map also selected the president when the map wasn’t enough.
The fifth was 2016. Hillary Clinton won the popular vote by 2.9 million votes. Donald Trump won the Electoral College 306 to 232. Geographic sorting had concentrated Democratic votes in California and New York — states already won by wide margins — while Republican votes were distributed more efficiently across the swing-state map.
Two of the five inversions have occurred in the last twenty-five years. The accelerating frequency is not coincidence. It is the mathematical consequence of geographic sorting compounding inside a system designed around the geography of thirteen coastal states in 1787. As Democrats concentrate in cities and Republicans compete more efficiently across the state distribution the Electoral College weights, the gap between the popular will and the institutional outcome widens. The distortion is structural. It is getting worse.
What does the swing-state map have to do with the commons?
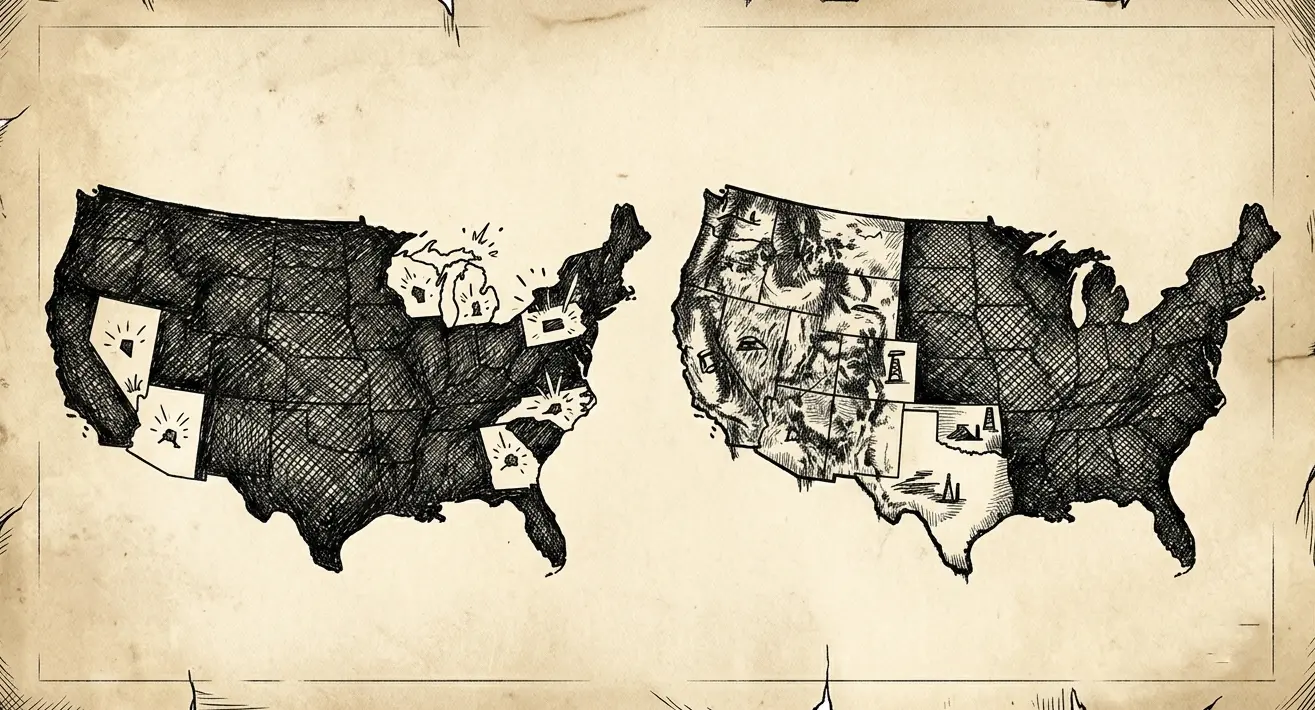
The seven states that received 97 percent of 2024 presidential campaign attention are Pennsylvania, Michigan, Wisconsin, Arizona, Georgia, Nevada, and North Carolina. Look at what they are not. They are not Alaska, with 222 million acres of federal land and oil production from publicly owned commons. They are not Wyoming, the nation’s largest federal coal producer. They are not New Mexico, which produces more oil from federal land than any other state. They are not Utah or Montana, where federal land holdings exceed 50 percent of the state’s total acreage.
The states that control the presidency are not the states where the extraction economy runs deepest on publicly owned land. The president who sets royalty rates, appoints the Interior Secretary, and decides how aggressively to enforce federal lease terms answers politically to an electorate selected by swing-state geography — not by the national population whose commons is being governed, and not by the communities whose land and water the federal extraction economy depletes.
The swing-state map and the extraction map do not overlap. That is not an accident. It is what a system optimized for partisan geographic competition produces when the commons is not a swing-state issue.
Sources
1. 2024 campaign concentration — 97% in seven states. https://www.nationalpopularvote.com — verify specific percentage against 2024 general election data.
2. California, Texas, New York, Florida zero general election visits.— Politico, New York Times, Washington Post.
3. 1824 election — Jackson popular vote, House selection of Adams. National Archives. https://www.archives.gov/electoral-college/1824
4. 1876 election — Tilden popular vote margin, Hayes-Tilden Commission, end of Reconstruction. Woodward, C. Vann. Reunion and Reaction. Oxford University Press, 1951. Ballotpedia. https://ballotpedia.org/Splits_between_the_Electoral_College_and_popular_vote
5. 1888 election — Cleveland popular vote, Harrison Electoral College win. Ballotpedia, ibid.
6. 2000 election — Gore popular vote margin 540,000. FEC certified results. Bush v. Gore, 531 U.S. 98 (2000). https://supreme.justia.com/cases/federal/us/531/98/
7. 2016 election — Clinton popular vote margin 2.9 million. FEC certified results.
8. Geographic sorting analysis. Red State Blue State Rich State Poor State. Princeton University Press, 2008.
9. Alaska federal land 222 million acres. Bureau of Land Management. https://www.blm.gov/alaska
10. New Mexico federal oil production — largest federal land oil producer.
11. Utah, Montana federal land holdings exceeding 50%. BLM Public Land Statistics. https://www.blm.gov/about/data/public-land-statistics
Block 6, Article 2. Stage 7 complete. © 2026 Steve Sagnotti.
Leave a Reply