Author: sts

  • Of Candlesticks, Stock Markets & RMDs

    Of Candlesticks, Stock Markets & RMDs

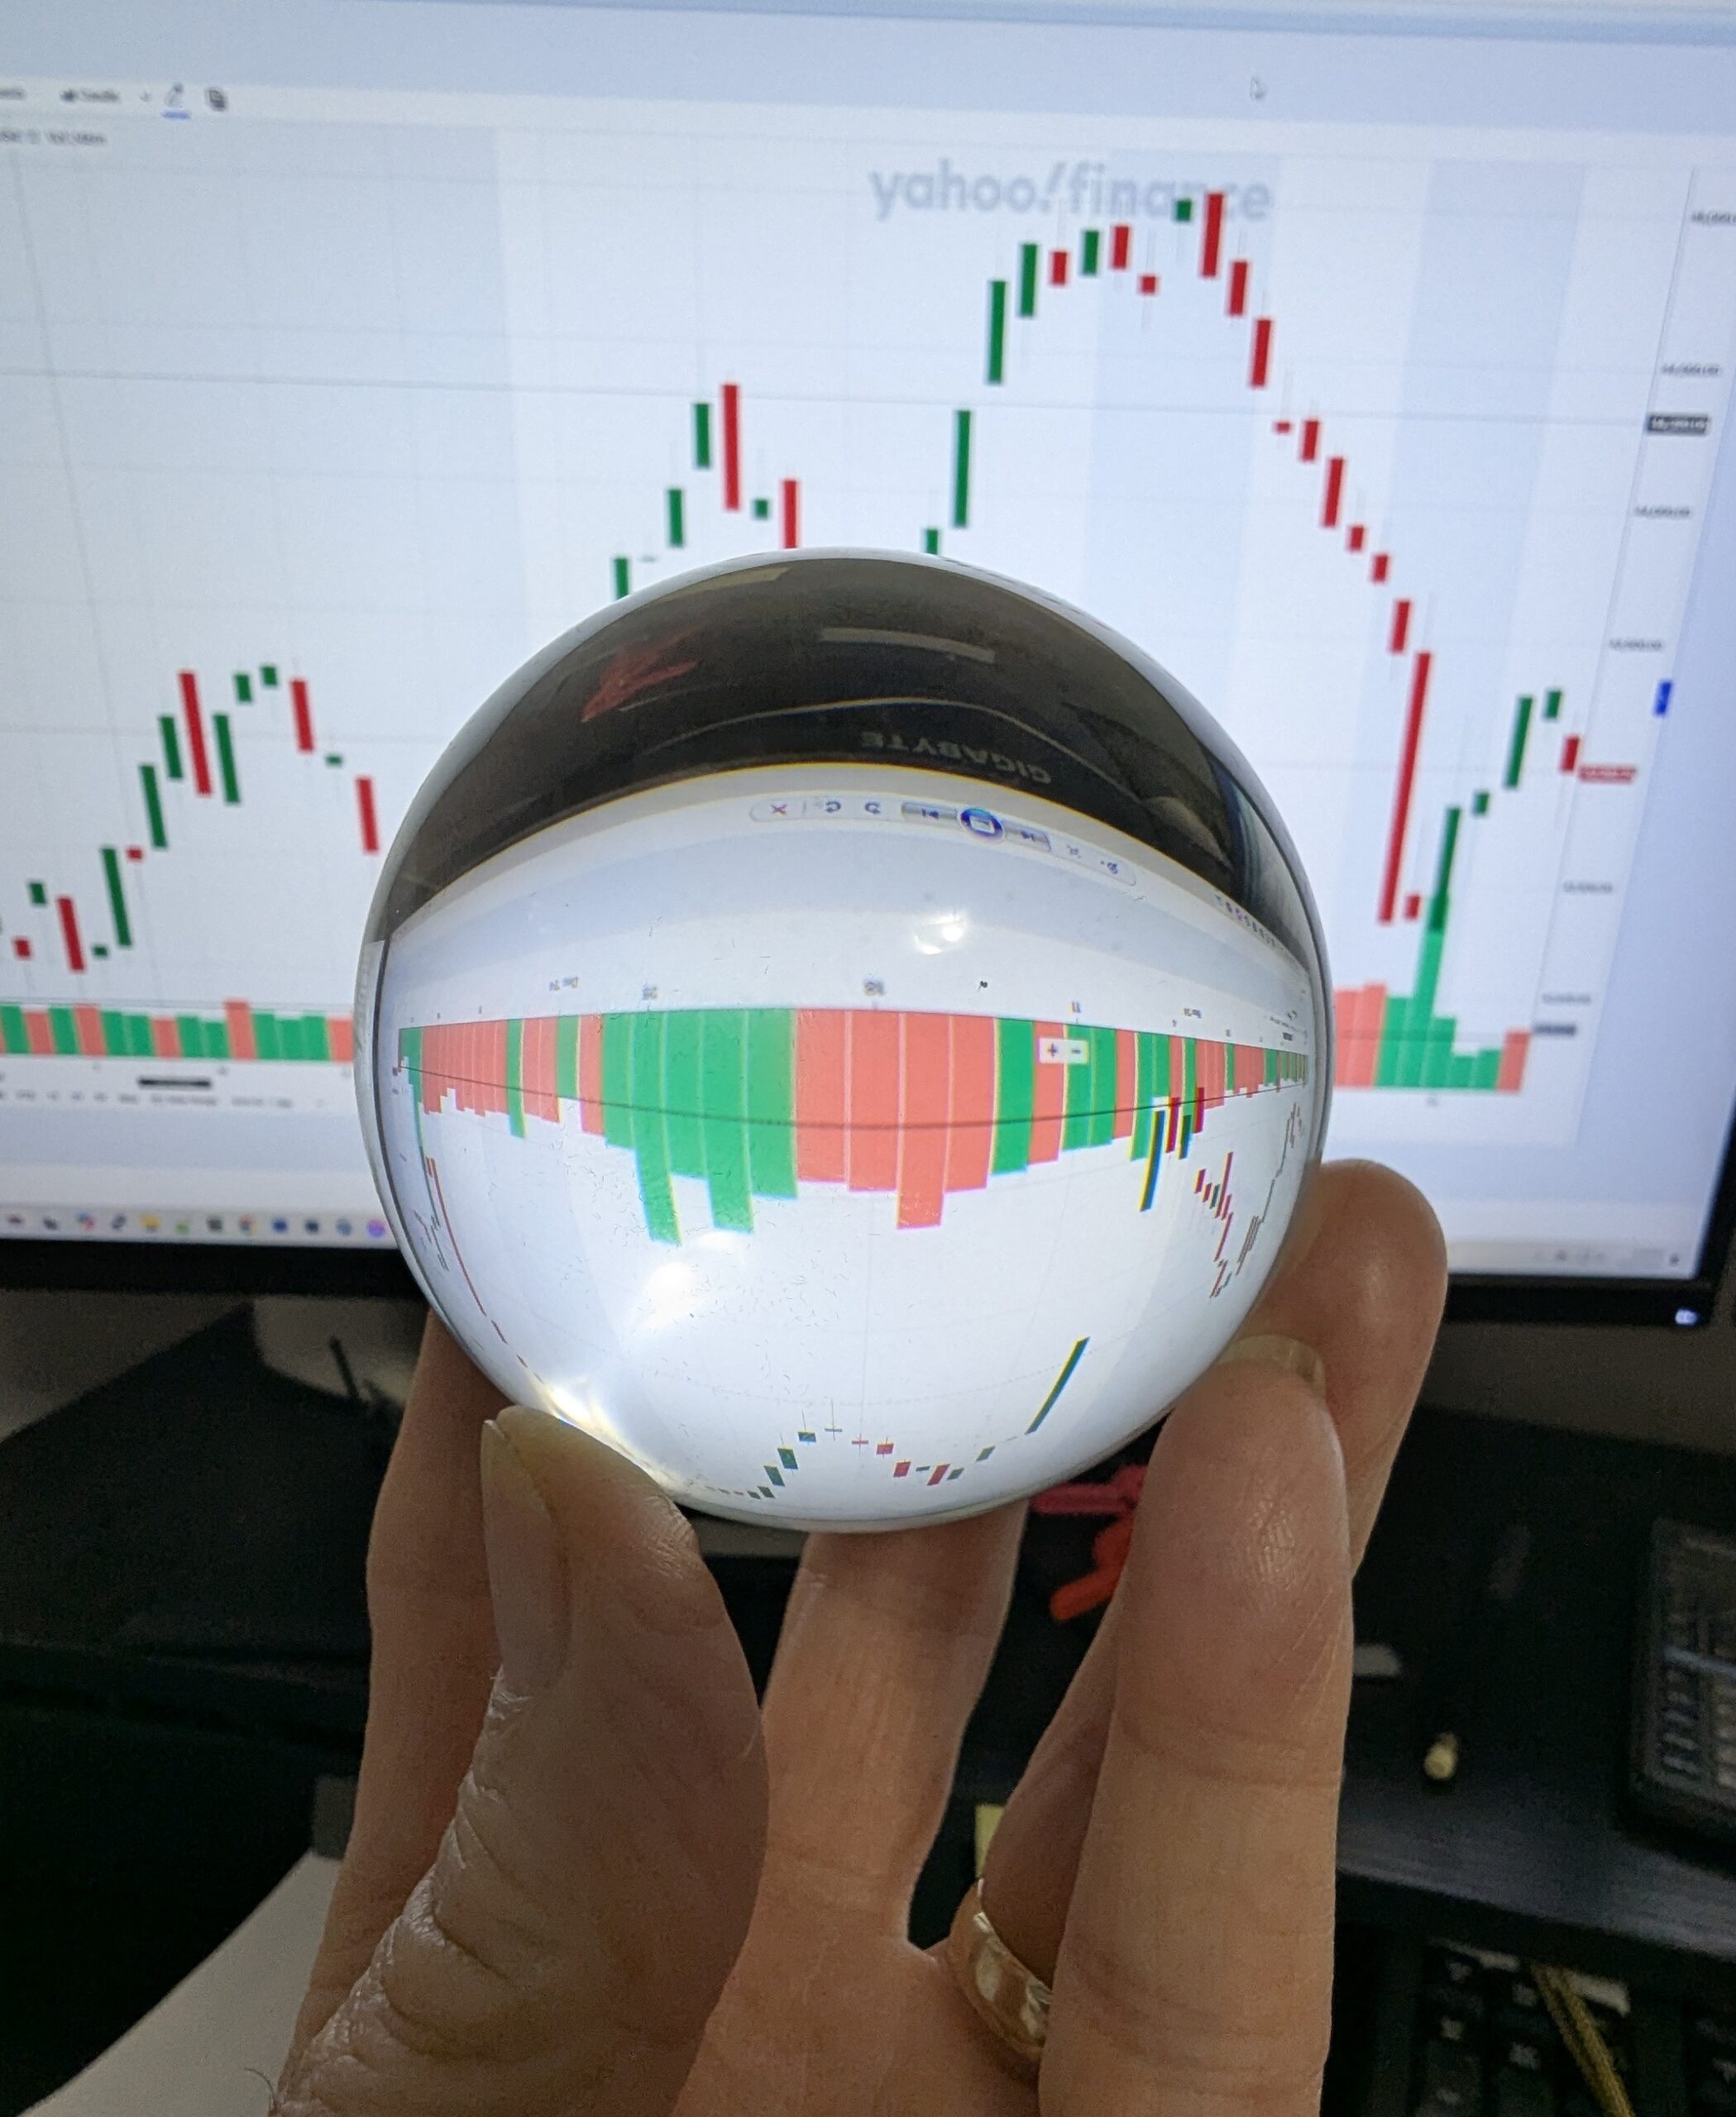
    Turbulence, turmoil & uncertainty are upon us; change is the only constant in the universe. Be prepared; forewarned is forearmed.

    My crystal ball is no help in predicting what lies ahead, however, there are sign to read if you know where to look and recognize what you see. What I see is a significant change in course and not for the better. If you have RMDs to consider you may want to follow along.

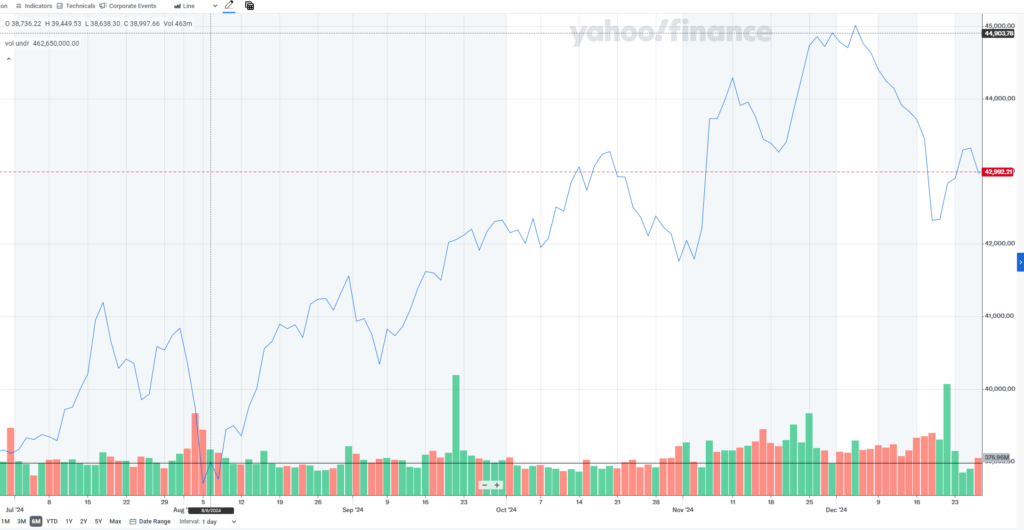
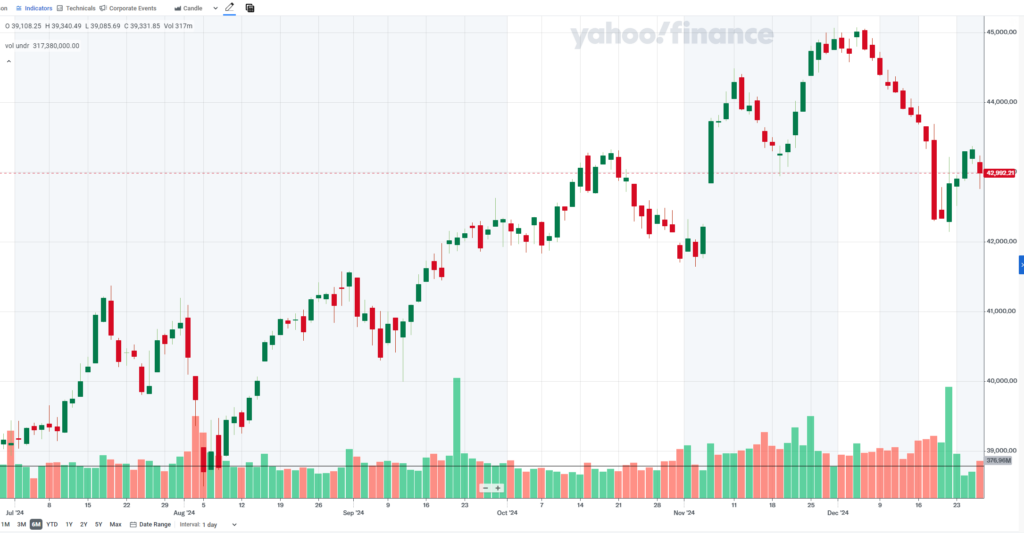
    The traditional line chart or mountain graph to depict the stock market is based on closes, daily, weekly, hourly; whatever time period is being used. This is a map of places stopped along the way, but tells no story of how that stop came about. This is a myopic view of the market, or sector, or individual stocks.

    The chart above is the standard line chart, the lower is the candlestick view, both for the past 6 months. Which tells you more? Most stock displays, regardless of chart type, use the bottom to provide bar charts to show volume for the period. I’ve added a black line across the volume at roughly the high point average through a majority of the period. Note that from early November the volume has been considerably higher than the average and for a much longer time than anytime prior. This is significant, we will come back to it later.

    In the 18th century Munehisa Homma, a Japanese rice trader from the Ojima Rice market in Osaka noticed that market prices were influenced not just by supply and demand but also by traders’ emotions. Homma began documenting price movements using what we now know as candlestick charts. These charts provided a visual representation of price changes over time, capturing the opening, closing, high, and low prices for each trading period.

    The primary intent behind candlestick charts was to understand and anticipate market sentiment. By analyzing patterns in price movements, traders could gain insights into market psychology, including fear, greed, and other emotions that drive trading decisions.

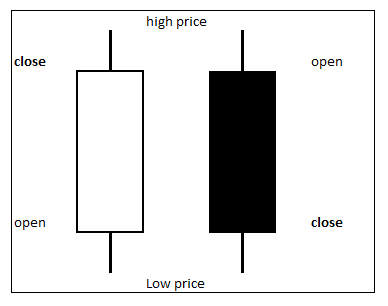
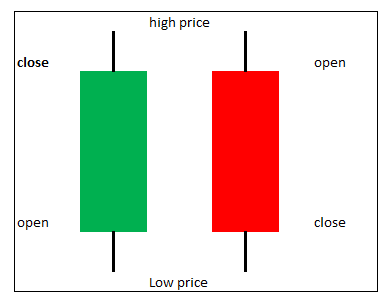
    Here are the two basic candlestick displays, colored or hollow. A green or white (hollow) candle indicates the market went up, the close was higher than the open. The red & black candles are the opposite, the close is below the open.

    The wicks, tails, shadows that rise above & below the body of the candle represent high (above) and low(below) range extents of the price during the period. Long tails can indicate the direction the market wants to go.

    The size of the candle body shows market sentiment. A large body shows strong market direction up or down. A very narrow trading range has the open and close being almost the same, this is a doji or spinning top it shows indecision, buyers and sellers are undecided. Hammers and shooting stars signal turning points have small bodies with long rising tails; think of Thor’s hammer sitting on the ground handle up, it’s the base and not going any lower. When this occurs at a peak it’s the final hurrah, a shooting star.

    There are several different multi-day patterns, bullish and bearish engulfment, 3-soldiers or 3-crows. There are several blogs and YouTube channels for more basic information on candlesticks for trading.

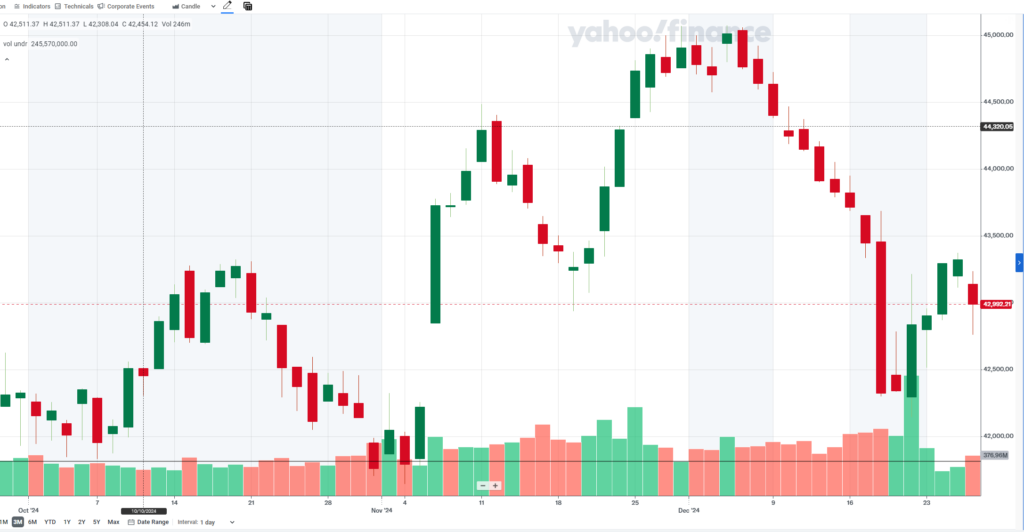
    Notice in early November, the chart is forming a bottom, a floor of support. On the 5th, election day it was a decent up day with light volume. The 6th was not only a very strong up day, it also opened way above the previous day’s close. This is a gap, the larger the gap the stronger the market sentiment; this was a huge gap up to open and then a very strong day. This is showing exuberance and giddiness in the market.

    So, about now you may be asking if there’s exuberance and giddiness in the market why the dire outlook? Put simply, there’s more to the story.

    An indicator used by one of the worlds’ greatest traders was given his name, although he did not create the indicator he just uses it. It’s called the Buffet indicator after Warren Buffet. It takes the entire U.S. stock market value and divides that by the Gross Domestic Product to come up with a value. The value is represented as either a number or a percent showing over valued or under valued state of the market.

    Buffet has unloaded millions worth of stock, citing the market as being overvalued according to the Buffet indicator when it was at 140% (1.4); currently it is over 203% (2.03), which is way overvalued.

    We can look at the world and see conflicts, formerly stable governments being unstable & failing. We see storms and flooding at 100 year and unprecedented levels. We see migration stressing governments and communities. We have an incoming administration promising change on a massive scale, possibly unleashing chaos.

    Smart money & institutional investors see all this too and are concerned about protecting what they have and getting out while they can. The markets don’t like turmoil, conflict, natural disasters, supply chain disruptions or political upheaval, but those appear to be headed our way.

    Volume has been extremely high for nearly two months, whether the prices were going up or going down. Remember every trade has a buyer and a seller. If you notice the ascent at the end of November were large up days with small gaps up; looking at the candles for the descent before Christmas looks more orderly, stair-stepping down, but both have similar volumes, smart money playing the markets in both direction and unwinding their positions in the process. They can’t do it too fast or it will spook and panic the markets which would cause a big crash, depriving them of profits, better to sell to the unwitting & ever hopeful at higher prices before the fall.

    My prediction is a slow drift lower with intermediary peaks and valleys on the way down, until the bottom falls out, probably mid to late spring if it’s going to happen.

    What Can You Do?

    The usual advice applies, cut back on expenditures were you can, avoid unnecessary spending, save cash. If you are in the markets avoid risk as much as possible, consider cash & cash equivalents.

    For those 73 and older with retirement accounts this warning has an extra layer of urgency. The market is near all-time highs. The Buffet indicator shows that the markets are way overvalued, meaning little room to go up and lots of room to go down. The end of the year is a few days away when the baseline for RMD calculations gets locked in.

    For those unfamiliar with RMDs, Required Minimum Deductions, it’s the way for the government to make retirees deplete their retirement account by the time they die. Each year they have to withdraw a minimum amount from their retirement account. The amount is determined by how much is in the account, divided by a factor tied to their age, each year the factor used as the divisor gets smaller so the RMD gets larger. This leads to tax implications and withdrawal strategies that aren’t germane for this discussion.

    What is important to note here is that the amount used for RMD calculation is based on what is in the account on Dec. 31st at year end. It doesn’t matter what happens during the following year to the account; RMD is based on prior EOY value. If the account drops significantly during 2025 there will be less money in the account to withdraw or use to pay taxes on the required withdrawal.

    There are no rules about how or when to take RMDs, just that the are calculated using the Dec 31st value. Many people withdraw monthly or quarterly; this year it may be wise to take the entire RMD early in the year while the market is up, just in case the market does tank. I’d rather miss a few dollars in profits if it means holding onto my nest egg.

  • January Full Moon -1

    January Full Moon -1

    I prefer photographing the full moon the day before it is full. In the camera you can’t tell the difference in the moon, but the ground has more daylight the day before, making for a better lighting balance between moon and ground.

    Here are a few local locations for moon rise alignment comps, of course they depend on mostly clear skies, which can be rare here in the Pacific NorthWET.

    St. Johns Bridge

    Hawthorne Bridge

    Hwy 26 west of Government Camp

    Portland Women’s Forum

  • Sun Marches North

    Sun Marches North

    December 21st was the winter solstice and the official start of winter. It is also the time the Sun starts marching north from our perspective here on planet earth.

    I take a prominent object on the skyline, visible from many angles and use that as a seasonal pivot. Because I’m in Oregon our most prominent skyline object is the snow capped Mt. Hood.

    Throughout the year I will visit different vantage points so that the sun will always rise from behind the mountain peak or close by from one of it’s flanks.

    I use PlanIt Pro to do this planning. The VR viewfinder mode sets Planit apart from all other ephemeris apps. The user simply draws a box on the screen and selects sunrise, moonrise, or sets, or crescent moons from the drop down, the date range for the occurance and the number of results are listed. clicking on the results lists them out. Adjusting the box dynamically updates the date list.

    This makes it real easy to know where to be to get that great sunrise, moon rise, etc. With the 3D model subscription you can preplan with many provided well known buildings, bridges & landmarks around the world to use with alignments with the sun or moon or Milky Way.

    If you are in the Portland metro area, or will be this spring. The calendar here has several sunrises listed for public parks and spaces. Lastly, after the summer solstice this pattern repeats marching south. The same locations can be revisited 6 months from last time, sometime to the day, but plan it out.

  • WordPress 101

    WordPress 101

    You can do it — Steve

    If you can type you can create a website. If you have an artistic eye you can make a pretty website, or use the supplied proven themes. If you can take a picture with your cellphone, and use drag and drop to copy that picture, you can add it to your website. From there it’s up to your time & interest as to where you take it.

    The cover photo above shows an image of the UI for creating this post. The left side has the blocks/widgets for laying out the elements. The right-side panel is for settings on some blocks and some additional manual styling.

    There are lots of YouTube videos on using WordPress, from short overviews to hours long deep dives. Watch a few videos, play with WP, throw it all away, do it again and you will start to get comfortable building a post with images, quotes, columns, groups and be a web guru in no time.

    Another one of those dashboards, this is the main one for WP where you can monitor site stats or jot down notes to start a future post, or of course navigate with the familiar left navigation to other features and functions to keep a site working.

    I happened to read an article today about the co-creator of WordPress, President of Automattic, head of the WordPress Organization and owner of wordpress.org, who is in a tiff with wordpress.com; this has been in the news the past few months and not worth pursuing here other than to say he’s a great proponent of open source, the main thrust of WordPress Organization, but he’s not opposed to making a profit via plugins; that’s the reason things are so bare bones.

    That explained quite a bit about my experience with WordPress. Everything on this site is done with the plane jane vanilla WordPress or a few free plugins, which are sorely needed and barely work. But, hey, it’s all free, shows what can be done and whets the appetite for that hidden feature that a few dollars will enable.

    WP comes with a media library, but it’s one big bucket, no subdirectories. If you want that functionality there’s a plugin for that. Unfortunately, not only are the good features disabled without paying, but the other plugins won’t recognize the sorting and subdirectories you’ve added, because they don’t know about the plugin. So, when you want to add an image to a post you have to find a thumbnail from the ever-growing pile of thumbnails.

    For the photographers out there with the multi-mega pixel sensors, wanting to highlight their work in pixel peeping splendor, be forewarned, the default maximum file upload to WordPress is a measly 2 meg. This setting is not easily changed, for the neophyte (me). It’s in a config file, that the default Docker install makes difficult to access.

    I ended up removing and discarding the WP container and recreated the Docker script to install it, specifying the install path and adding a database management tool to the stack. About the time the new container was up and running I’d found a free WP plugin that would let me set the upload to a new minimum for the max threshold at 16MB with option for much larger. But I’m serving from a tiny underpowered Pi, so I won’t servr any large images.

    In fact there’s another plugin Smush to squeeze and smush images even smaller for faster load times, I am using that plugin getting a whoping 8% compression.

    My basic approach to this site has been that I’l put in the time to learn how to do what I want. I’ll use the free tools to see how far I can push them and how much I can get from them, before I throw money at it. There are several plugins that do the same or similar functions so you have to shop around.

    From some articles found while researching a gallery to use with WP I was steered to two, I tried them both and have chosen the Modula gallery. It doesn’t recognize the subdirectories created by the media management plugin, but that plugin recognizes the gallery plugin structure, which are the same. I’ve found that importing directly into the gallery not only saves a step of loading the gallery, but the bigger task of finding the correct thumbnail to load from its one bucket view of all the media.

    For Calendars there are several, but they all tend to be for ticketed events. For what I wanted they were overkill. I’ve chosen Sugar Calendar as the best fit for my needs; I just wanted something I could share date for good celestial photo ops, these typically occur for a few to several days. Reoccurrences are not part of the free calendar package, but with the help of the database management tool I added to the build script I looked into the database found the table with the calendar events and editing 3 fields on the event record to get it reoccurring on the calendar without being all day events. A sunrise from Portland Women’s Forum does reoccur, but isn’t an all day event on the calendar now.

    There’s a lot of power & capability in WP that I have yet to utilize, first I have to learn how to wield it. That will occur on a needs basis, when I need it I’ll learn it; maybe by then I can just say, “make it so.”

  • What’s in the Pi Shop

    What’s in the Pi Shop

    The Pi shop is 3 Raspberry Pi 5s, the first model with PCIe so they can take real storage media, like NVMe M.2 drives found in modern computers.

    The Pi devoted to public facing traffic, like this website only has 1 TB, so there is a limit to how much I can say or the number of pictures I can post, But not to worry, that is still more than I can fill.

    The other two Pis have 2 TB each for my media server, private cloud and home file storage.

    One thing I’ve learned in learning how to build every part of the Pi shop is to ask for help. I am not a trailblazer, someone has done this before, and most likely made a YouTube video about it, certainly a blog post. So, there is no reason to feel stuck or get frustrated, watch a video, read a blog post. Still stuck, ask Google, which will probably point you to a subreddit post on your exact predicament & solution, or ask the new young turks, Copilot & Gemini, they have each been very helpful on a wide range of topics from philosophy to software configuration scripts.

    The Pi shop is built from free Open Source software; that’s free as in air & beer. It does come with a cost and that is born by teams of dedicated people with vision about the success of a piece of software; there are ways to provide support. Those teams may be a small handful to hundreds of individuals, typically geographically dispersed, checking in changes to a common repository.

    Git is the de facto standard repository for source code control, a way to track changes to a body of code to accomplish a task. Source code control is a requirement for a multi-programmer project to eliminate bugs or identify when and where they were introduced.

    Github is a repository of source code repositories. In days of old you would go to the soda fountain or mall to hang out and be cool. Today, one way to show your creds and be cool is to have, or be involved with, one or more code projects on github. Anyone and everyone is free to look at the code in open source, so bugs get caught and little chance of malicious code being inserted, when downloaded from a reputable source. If others like what you are doing they can join the effort.

    Think of it as a form of digital busking (playing for change$) or a digital jam session.

    With that out of the way, here are the apps/services currently on the Pi shop:

    Jellyfin, the media server currently holds 128 movies ripped from my DVD collection, they take 113GB of space, about 1GB per. The music collection has 500+ artists performing more than 2,000 songs. Family photos span the past 75 years, with more being added. Home videos and time lapses get there own space.
    There are several plugins available for Jellyfin, from adding closed captions to scouring the web for more content.

    Immich is the replacement for Google Photos. With a 2TB sandbox for my cellphone images to automatically upload to I no longer hit a 15GB ceiling that Google imposes before the meter starts running on paid storage. A very powerful image program that now with a domain name it’s easy to share albums selectively with anyone anywhere

    Nextcloud is the private cloud space for the Pi shop. Here, notes, files, images, video, links and all the other digital debris & cyber dust balls of the modern connected life can be kept safely and securely. This is also touted as a collaborative environment for working with others on projects. I haven’t looked into that aspect of it yet, been just a bit busy on related endeavors.
    Nextcloud also has plugins to extend the functionality, white boards, Talk (an in the app Zoom), image galleries, and many many more.

    Pi hole was my very first Pi app. I got it to address my desire for add free browsing. For print/display media this works great across my entire Lan. Not so much for YouTube, but there may be solutions there too, stay tuned.

    The Pi shop is running three different image gallery/album apps for evaluation, Pi Gallery2, Piwigo & Photoprism. Each are strong contenders with some great features. However, now with the website, Jellyfin & Immich I’m not sure where or how they might fit in the solution, but that’s where I thought I was going when I started, a supercalifragilisticexpialidocious digital memory display thingamabob. (when was the last time you fit that into your discussion correctly)

    To maintain the Pi shop there are a handful of services running on each Pi. The Docker framework to host the containers providing the various services. Portainer to administer Docker and the Containers. Grafana with its supporting cast to provide a graphical look into the inner workings of each Pi. Then Homer as the dashboard for each Pi and Homarr as the dashboard for the network services mentioned.

    I had the above in place and working, mostly, when I started realizing using Tailscale, while working, didn’t have the ease or elegance I hoped for. The Immich and Nextcloud apps didn’t like using the internal IP. Getting a domain name (Dec. 1) and Cloudflare tunnel (Dec. 2) were the next steps taken. This made the apps happy when at home and away.

    The domain name also meant, for the price of learning WordPress (oh Joy, another learning opportunity), copying a few image files and trying my hand at writing content to inform and entertain. I too could be a publishing mogul. Or was that midget?

    WordPress is the publishing app of choice for nearly half the web. It’s sort of a ménage à trois between a word processor, a spreadsheet (range selections & grid matrix) and a publishing program, except that’s what it is. (this is slated for one or more upcoming posts)

    Over the course of a week, in my spare time, I became productive enough to create a basic no frill website. In the two weeks since then I’ve been correcting beginner mistakes and creating some content for visitors, i.e. is this page and site.

  • Is Self-hosting safe?

    Is Self-hosting safe?

    How can I securely and safely run a self-hosted website from my home office you may ask? In a word, curiosity.

    The Pi serving this page has no original data, only copies. So there isn’t a concern with data loss. The first line of defense is a strong password, done. Second is a strong firewall and no unnecessary ports opened, done & done. Next use secure connections, note you are on HTTPs, just like shopping or banking online.

    Securing the Lan is on me. I’ve enlisted one of the web’s bigger players, Cloudflare with their zero trust account, to create a secure encrypted tunnel from my Lan to their servers. They also provide the secure connection between your browser and their servers before putting you into my secure tunnel.

    I’m less than a gnat on the behind of the elephant that Cloudflare is. I’m hiding in their shadow while they keep the internet safer. The Pi shop holds no secrets and is an underpowered computer well suited to small time serving needs. I doubt I am of much interest to nefarious players and have little to lose, at worst reformat and rebuild the Pi.

    Part of the zero trust account is that Cloudflare takes care of the malicious traffic. Supposedly only legitimate web requests get sent to my server, time will tell.

    In order to create a zero trust account with Cloudflare requires having a domain name. A website was not on my radar when I started my Picture Pi project but became easily possible with the groundwork already laid.

    As I built out the Pi shop I realized accessing it from the wider web would be more than cool, it would be helpful. How can you use a private cloud if you can’t get to it when out and about?

    Your ISP has provided you with a public IP address for your home Lan/router. Unlike the phone company or the post office, who don’t change your number or address, your ISP does change your public IP address periodically, unless you pay extra to have it not change.

    What address or phone number would you give out if it changed once a year? That has been the problem trying to access self-hosted services from the internet; here today, gone tomorrow, because the address changed.

    One of the earlier ways to get around this change of address was through the use of a third party who would listen to a periodic ping from your system, when it noticed the Dynamic IP address changed it would update it’s records to the new address. This way it could route traffic intended to your network correctly. Duck DNS is one provider for this type of access. I didn’t start there.

    I started with Tailsscale. This is a node based architecture requiring a small piece of software be installed all the computers or smart devices you want to connect with, up to 1000 of them per user. And you can add two friends, all for free, after you create a Tailscale account.

    Tailscale uses that installed app to create secure encrypted tunnels, but these are node to node (device to device). I’m using this as a secondary access for my Pi shop services now, relying on Cloudflare for primary access.

    If I encounter problems I can always lock things down, page by page, the entire site, the entire tunnel or a combination of each of those means. My preference is to leave the website open as it is, while keeping the rest of the Pi shop locked down for my use. I’ll see where usage leads.

  • Planit Pro for photo planning

    Planit Pro for photo planning

    Ever since I discovered Planit for Photographers I’ve been hooked, it’s way better than sliced bread. Rises and sets of the sun and moon, providing time and azimuth from any point on the planet. Tides for shorelines, also anywhere. How about a planet, star, constellation, asteroids, comets, all covered in Planit Pro for a 1-time fee $10, or most of the features in the free version.

    All of my sky shots are pre-planned using Planit.

    Add the 3-D model subscription and get 3-d models in viewfinder view for planning precise alignments between celestial and earth-bound objects. A few lines of code allows me to create simple models that are good enough for my needs. The model below allowed me to pre-plan the image above.

    To create the model it required this code. There are 3 cubes (cu), 3 cursor relocates (v) and 1 cone (co). Not elegant, just a guess at dimensions and set by overlaying against a satellite image, tweak as needed. The default unit is meters and often have to rotate the image so these lines are included in all my models. The model UI has an embedded cheat sheet that can be clicked to select object, then just enter dimensions.

    The User interface for Planit is elegant and hide lots of complexity; Just about everything can be clicked on or long-press, or both to get to ancillary functionality.
    The top bar is the ephemeris functions, the middle is the map & viewfinder; the bottom bar is the time line with multiple viewing modes. Note the YT icon in lower left, contextual video tutorials at a click

    The top bar contains all the ephemeris functionality. Swiping left or right on the top bar navigates from one function to the next, clicking the colored bubbles just below the top bar will navigate directly to the selected function.

    Swiping down on the top bar brings up the main menu. Each row is color coded, grouped by function and are direct equivalents of the bubbles below the top bar. If you don’t see the bubbles, but get labels, this can be selected in the settings.

    The timeline has 5 views; year, month, day, hour & minute. Tapping on the left half of the timeline increases the time increments, tapping on the right half decreases the time increments. This is a continuous loop so you can go years to minutes or minutes to years. Swiping left or right changes the date/time, causing the rest of the app to react to the change in real time.

    The day view shows the phase of the moon with the quarters, new and full underscored. The hour view has black for night, blue for day and a rainbow for sun rise & set. If the moon is above the horizon it is represented by a blue line on the bottom of the time line. If a Planet, comet, what ever the ephemeris is set for, a yellow line appears on the top of the time line when it is above the horizon in true dark. In the case below the Milky Way is shown above the horizon and the details of elevation and azimuth are in the timeline for both Milky Way core and also the moon.
    This is a great UI jam packed with nuance, elegant in a word.

    It is possible to have PIP with Planit. By moving the camera pin in the satellite view the inset viewfinder view is updated in real time. By tweaking the camera pin and the timeline I know exactly where and when I need to be to get the shot

    A light pollution map is also part of Planit. I get to call Oregon home, it is one of the last large dark sky areas in the US. Lake County, along the CA border was recently named the world’s largest dark sky park. Neighboring Harney and Malheur counties slated to join too.

  • DIY

    DIY

    I grew up working with tools, fixing, maintaining & modifying things. This was mostly out of necessity, there was barely money to buy parts, certainly not to pay someone for markup & repair. If it didn’t take an expensive tool or special knowledge, and sometime even then, we would do it ourselves or make the attempt.

    Sometimes it’s just for fun, sometimes it’s to build a better mousetrap, but DIY projects are a great way to learn something and usually you get what you want. Here are a few of my DIY projects from the past few years.

    My 2016 F150 4×4 with hi-rise canopy was a retirement gift to myself. The first thing I did was build some multi-use furniture. What looks like bench seats are that, and storage space below the hinged seat that also extends out to make a single bed on either side or double with both. There’s also a power wall for charging devices; a 15amp inverter for 110v ac, a 2nd battery & solar charging.

    A couple of years back I came across an aftermarket kit to turn my dumb F150 into a smart F150 by ripping out the dash, a first for me, and installing a custom Android tablet. The Yulu e10

    When the smart dash died a few months back the downside of DIY reared its head, now I had to fix what broke. Thankfully, I was once a bench tech for Tektronix; I had to dust off some skills needed to find that a diode in their aftermarket DC filter died. Back in the day this was a $0.05 item, retail from Radio Shack or any components supply house. Now those are all gone and it’s a dollar a piece in quantities of 5 or 6 on Amazon or eBay, or I could buy the same DC filter online for $12-$15. Either of these would require some cutting and soldering. The third option was to spend $55 for a new harness. Which solution would you choose?

    Another F150 related DIY endeavor was a 4-tire inflation & deflation harness. When driving in Sand, mud & snow significantly reduced air pressure in a tire will also significantly increase the contact patch giving the tire better traction in an reduced traction environment. Because all 4 tires are attached at the same time they all increase and decrease at the same rate. To quickly inflate the tires when needed in the field a good portable compressor is required. These typically come with non US standard pneumatic fittings and no pressure cut-off. Another DIY project to go with the hose.

    LED lights on a spool, so many possibilities. Like many things in my life I can OD quickly on some projects. I have AA battery powered RGB light wands, intended to hang from popup canopies. I’ve built garage, shop & bench lights from white LEDs. And a light box for sorting slides & negatives of as a studio light, so many possibilities.

    Raspberry Pi computers. I understand these little toy computer are good for little side projects. Maybe if I find some time I’ll see if I can find a good use for one.

  • Dashboards

    Dashboards

    What is the dash in dashboard? As a verb it means to travel in a great hurry. When a horse dashes off (noun), there is often debris flung behind. The debris from the horse’s dashing is also called dash.

    In carts and wagons boards were placed behind the horse to protect riders from getting a load of dash in their lap, hence dashboard. This became a great place to rest your feet, hang your cup-holder, even mount a chalk board to monitor how many horsepower you were using.

    The evolution and standardization of system control & monitoring, climate adjustment and entertainment selection has meant that just about anyone can get into just about any vehicle and make use of the ‘dashboard’ to control the vehicle.

    In computers it’s much the same, a dashboard let’s you monitor & control a system without knowing how to build it, just know if it’s working properly. My Pi shop has several dashboards, they too are fairly standardized so just about anyone can understand their use.

    Doing things in triplicate helps me better remember how to do something; standardization also helps. In this case all of my Pi have the same base build up through Docker, Portainer, Homer, the Grafana monitoring stack, and the dashboard above . From there each Pi has a different set of apps and services to spread the load.

    This is the Grafana monitoring dashboard, the top row gives me, at a glance, the status of key indicators for the system. The lower panels provide information on specific resource usage by container, either in aggregate of any one of them can be isolated by simply clicking the container label in the panel. The data is available from minutes to weeks or months at a glance. This Pi-hosted YT video goes through the set up,. one of the few with preconfiguration steps

    One common interface is a navigation pane on the left and a detail pane on the right, this has been used by the file explorer for decades and it is still common today because it is somewhat intuitive.

    Cloudflare uses the 2-pane, left nav, right detail user interface. I’m writing this about 2 weeks after getting a Cloudflare account and tunnel, the domain name & URL have not been published. I believe most of this traffic is from bots; although there have been more than 90 attempts to log into the WordPress admin account during this time as well, and that isn’t from bots.

    Portainer, the Docker container mangers also uses the left nav, right detail panes. These are a few of the 200+ templates available with the Novaspirit Tech’s template file. Most, with one click, will deploy the container(apps & services); some are noted with pre-work to ensure a smooth install, mostly by creating an install directory.

    Immich, my Google Photos replacement, works much like everything else, left nav, right detail. I’m still figuring out the workflow, but no issues so far.

    I’ll end my missive on dashboards with this screen shot from Jellyfin my home media server. The base interface is similar to Netflix & Prime. It also has the hidden, fly-in left nav pane to fall back on.

    In olden days it was the backside of the dashboard that was the working side catching all the debris. Now it’s the front side, often in a slap-dash form that displays all the debris so we can try to control it. Sorry , I have to dash.

  • Painting Shrooms

    Painting Shrooms

    Light painted mushrooms are fun and easy to make, both when capturing the photons & processing the pixels. It is a great way to learn Photoshop or any layered image editor, how to master the use of layers and masks.

    To take the picture you just need a way to support the camera at mushroom height and able to focus from a few inches away. A bean bag or tripod with a column that inverts will hold the camera low to the ground. A macro lens or focus-tubes, hollow tubes placed between the lens and camera that allows the lens to focus very close to the front of the lens for macro work will be needed. Also a small flashlight that isn’t terribly bright, the flashlight on a phone will work if that’s all that’s available.

    Take your time getting a pleasing composition; make sure the sky is not in the picture (will be too bright) and that there are no distracting elements. Once you are happy with the composition do not move the camera for the duration of the shots other than to change exposure and be careful to not bump the camera when doing so

    A base image is needed. this will be what you build the rest of the image from. It needs to be underexposed about 1-stop with an exposure of 1″-2″ and aperture of f/11, adjust ISO to get that exposure using the other values given.

    Once you have a base image carefully, without bumping the camera change the aperture to f/16 and shutter to 3″-5″. This will have 2 affects on the resulting images; the aperture change will increase the depth of field (more will be in focus front to back) and it will dim the rest of the image. The longer exposure time allows more time to move your light so you aren’t rushed and can take your time light painting. be careful to not overexpose with the light, watch the histogram for any crushing on the right side.

    Rinse and repeat with other comps or mushrooms. Most of all have fun being out in nature.

    I use a Lightroom to Photoshop workflow for images like this. I’ll do a base adjustment in LR and then bring them into PS to blend into the final image.

    In LR I adjust the base image to have good details in the shadows but is overall underexposed slightly. The light painted images I tend to darken further and drop the highlights, what I want to see is clear details in the highlights and gills of the shroom, don’t blow these out during capture.

    Once all the images are ready in LR, select the base and painted images for merging the edit as layers in PS. Once all the layers are in PS select the base image and move to be the bottom layer. Select all the layers then align the layers.

    The next step is to simply select each light painted layer one at a time and change the blend mode to lighten. This will allow the light parts of the light painted image to be seen over the base image. Each layer can be toggled on and off (eyeball icon) to see what it adds to the image. A mask can be added to the layer to block out unwanted portions of the light painting from getting through. Also, the layer can be turned down it does not come through as strong.

    Now it’s just a matter of playing with each layer until you get what you want. Have fun creating something unique.