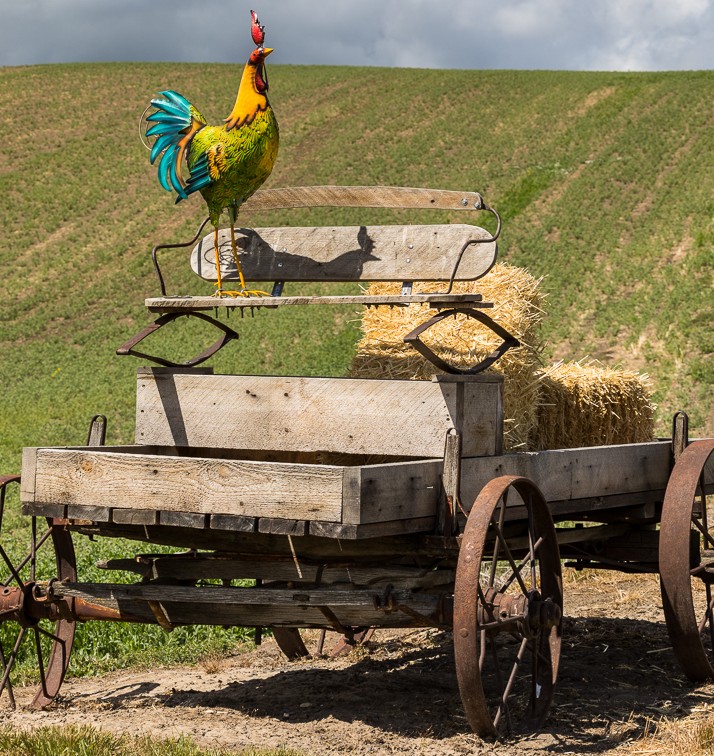
What is the dash in dashboard? As a verb it means to travel in a great hurry. When a horse dashes off (noun), there is often debris flung behind. The debris from the horse’s dashing is also called dash.
In carts and wagons boards were placed behind the horse to protect riders from getting a load of dash in their lap, hence dashboard. This became a great place to rest your feet, hang your cup-holder, even mount a chalk board to monitor how many horsepower you were using.
The evolution and standardization of system control & monitoring, climate adjustment and entertainment selection has meant that just about anyone can get into just about any vehicle and make use of the ‘dashboard’ to control the vehicle.
In computers it’s much the same, a dashboard let’s you monitor & control a system without knowing how to build it, just know if it’s working properly. My Pi shop has several dashboards, they too are fairly standardized so just about anyone can understand their use.
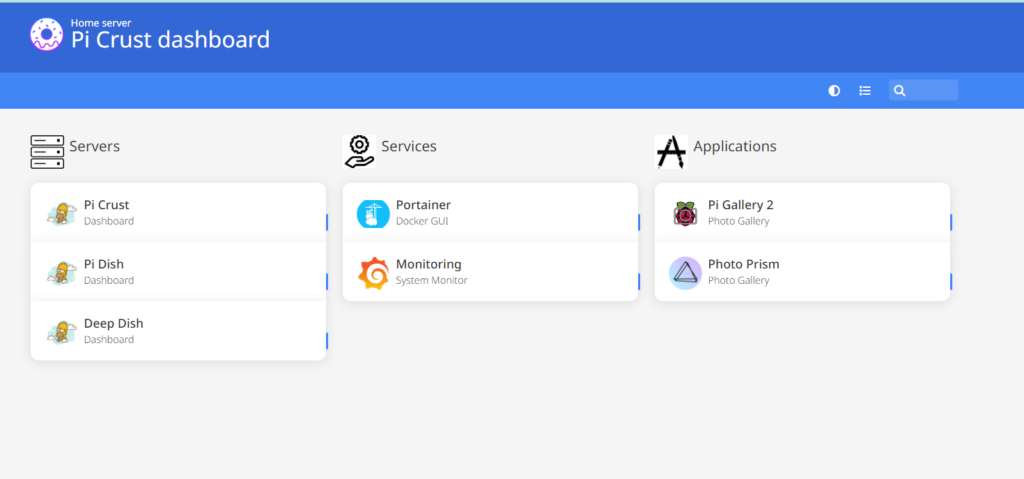
Doing things in triplicate helps me better remember how to do something; standardization also helps. In this case all of my Pi have the same base build up through Docker, Portainer, Homer, the Grafana monitoring stack, and the dashboard above . From there each Pi has a different set of apps and services to spread the load.
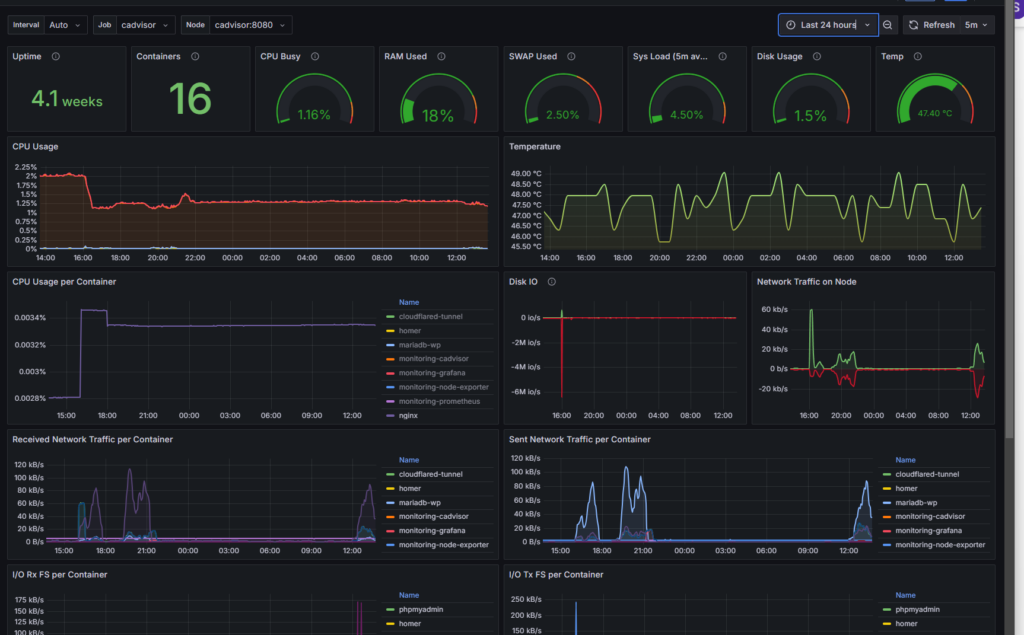
This is the Grafana monitoring dashboard, the top row gives me, at a glance, the status of key indicators for the system. The lower panels provide information on specific resource usage by container, either in aggregate of any one of them can be isolated by simply clicking the container label in the panel. The data is available from minutes to weeks or months at a glance. This Pi-hosted YT video goes through the set up,. one of the few with preconfiguration steps
One common interface is a navigation pane on the left and a detail pane on the right, this has been used by the file explorer for decades and it is still common today because it is somewhat intuitive.
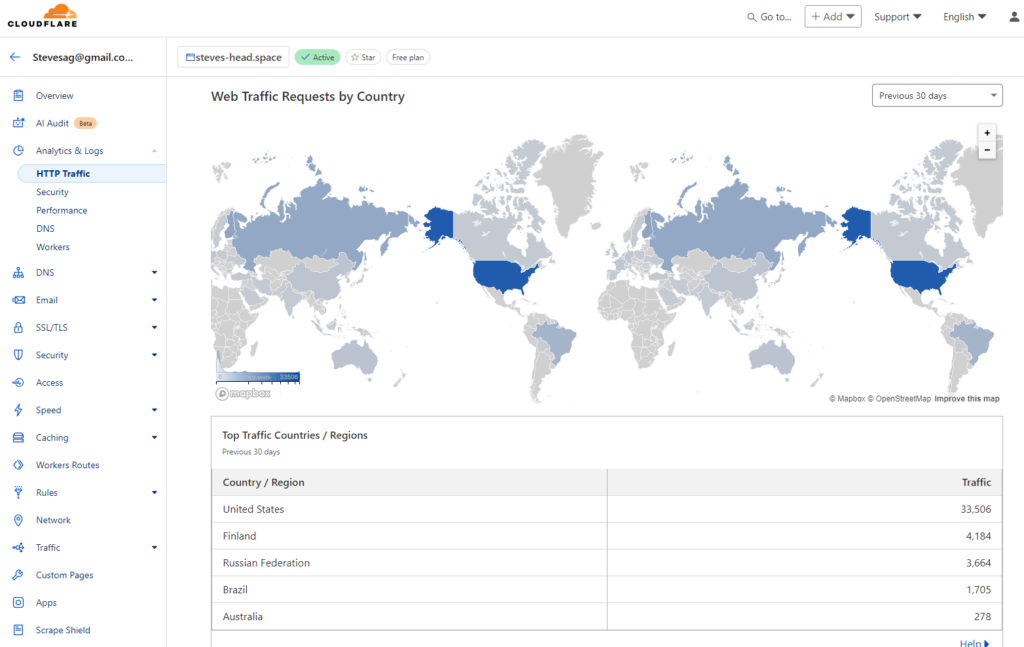
Cloudflare uses the 2-pane, left nav, right detail user interface. I’m writing this about 2 weeks after getting a Cloudflare account and tunnel, the domain name & URL have not been published. I believe most of this traffic is from bots; although there have been more than 90 attempts to log into the WordPress admin account during this time as well, and that isn’t from bots.
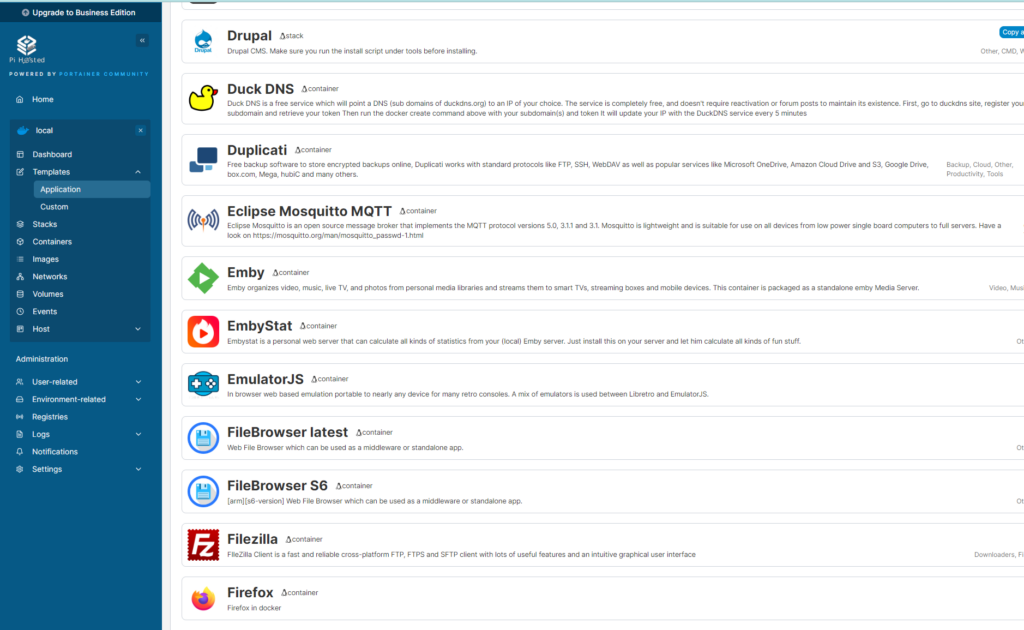
Portainer, the Docker container mangers also uses the left nav, right detail panes. These are a few of the 200+ templates available with the Novaspirit Tech’s template file. Most, with one click, will deploy the container(apps & services); some are noted with pre-work to ensure a smooth install, mostly by creating an install directory.
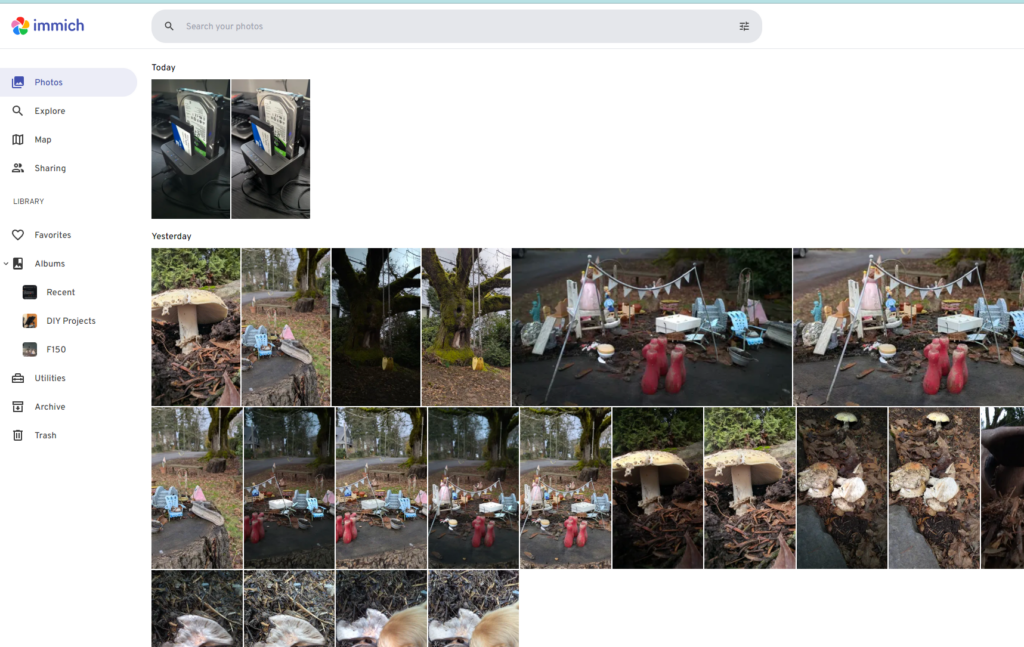
Immich, my Google Photos replacement, works much like everything else, left nav, right detail. I’m still figuring out the workflow, but no issues so far.
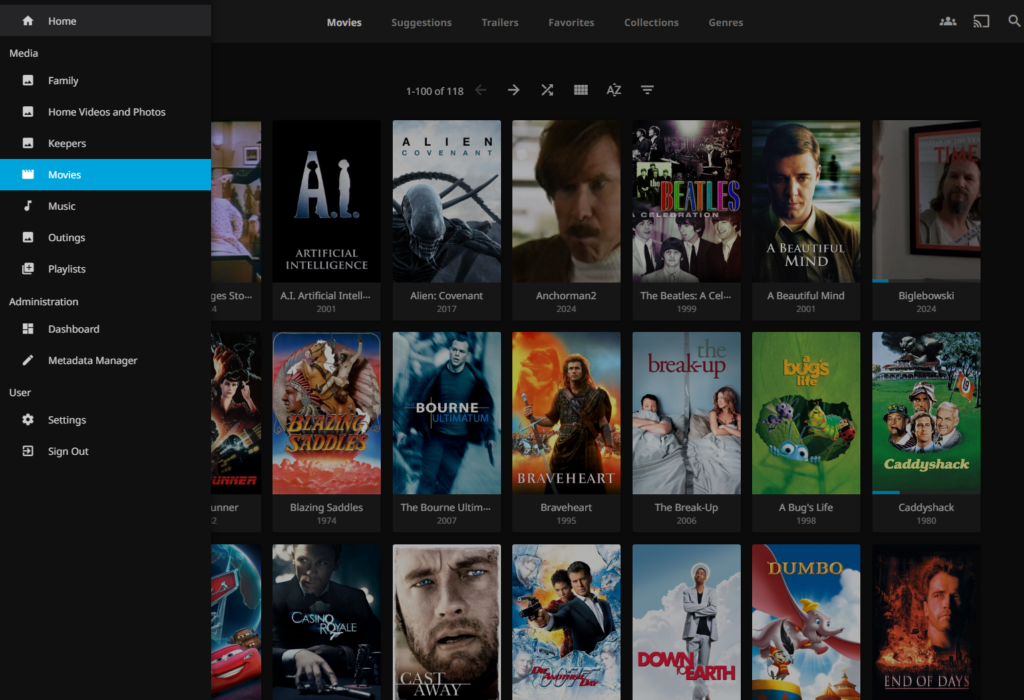
I’ll end my missive on dashboards with this screen shot from Jellyfin my home media server. The base interface is similar to Netflix & Prime. It also has the hidden, fly-in left nav pane to fall back on.
In olden days it was the backside of the dashboard that was the working side catching all the debris. Now it’s the front side, often in a slap-dash form that displays all the debris so we can try to control it. Sorry , I have to dash.
Leave a Reply